


Monthly Sunspot Numbers
(last updated 01 Jul 2026 10:36 UT)
OBSERVED AND PREDICTED SOLAR INDICES Prepared by Bureau of Meteorology Australian Space Weather Forecasting Centre Issued on 01 July 2026 -------------------------- SMOOTHED SUNSPOT NUMBER -------------------------- Year Jan Feb Mar Apr May Jun Jul Aug Sep Oct Nov Dec ----------------------------------------------------------------------------- 2008 6.6 5.6 5.1 5.1 5.3 4.8 4.0 3.8 3.2 2.4 2.3 2.2 2009 2.5 2.7 2.9 3.3 3.5 4.1 5.5 7.4 9.5 10.9 11.7 12.7 2010 14.0 16.1 18.5 20.8 23.1 24.6 25.2 26.4 29.5 34.5 39.1 42.5 2011 45.7 48.8 53.8 61.1 69.3 77.2 83.6 86.3 86.6 87.4 89.4 92.5 2012 95.5 98.2 98.3 95.1 90.9 86.6 84.5 85.1 85.3 85.8 87.7 88.1 2013 86.8 86.1 84.4 84.3 87.0 90.9 94.6 99.0 104.7 107.0 106.9 107.6 2014 109.3 110.5 114.3 116.4 115.0 114.1 112.6 108.3 101.9 97.3 94.7 92.2 2015 89.3 86.1 82.2 78.9 76.1 72.1 68.3 66.4 65.9 64.3 61.2 57.8 2016 54.4 52.5 50.4 47.8 44.8 41.5 38.5 36.0 33.2 31.5 29.9 28.5 2017 27.8 26.5 25.7 24.8 23.3 22.2 21.0 19.6 18.3 16.7 15.4 15.0 2018 14.2 12.6 9.9 7.8 7.5 7.2 7.0 6.7 6.5 6.8 6.7 6.0 2019 5.4 5.0 4.5 4.3 3.9 3.7 3.5 3.4 3.1 2.6 2.0 1.8 2020 2.2 2.7 3.0 3.6 5.6 7.9 9.0 9.5 10.5 11.9 13.6 15.3 2021 17.2 19.0 21.7 24.8 25.8 27.6 31.4 35.4 40.2 45.2 50.8 55.9 2022 60.1 64.7 68.7 73.0 77.4 81.1 86.7 92.6 96.5 99.0 101.2 106.7 2023 113.3 117.8 121.1 122.9 124.2 125.3 124.6 124.3 124.0 124.8 127.9 129.5 2024 131.1 136.9 141.4 144.4 149.1 152.8 155.0 156.8 159.4 160.9 157.2 151.2 2025 146.2 139.8 135.9 133.3 128.6 124.7 122.4 118.2 112.9 108.3 106.7 106.8 2026 104.2e100.3e 96.1e 92.5e 90.3e 87.4e 83.5e 81.4e 80.1e 78.6e 76.3e 73.0e 2027 70.5 68.2 65.8 63.5 60.9 58.2 55.0 52.2 49.6 46.9 44.8 42.9 2028 40.8 38.4 36.1 34.2 33.2 32.5 31.2 30.0 29.4 29.1 28.6 27.8 2029 26.6 25.3 24.3 23.2 22.3 21.2 19.2 17.7 16.9 16.0 15.2 14.8 2030 14.6 14.4 13.9 12.7 12.0 ============================================================================= --------------------- SMOOTHED 10.7 CM SOLAR RADIO FLUX --------------------- Year Jan Feb Mar Apr May Jun Jul Aug Sep Oct Nov Dec ----------------------------------------------------------------------------- 2008 70.2 69.8 69.7 69.7 69.7 69.3 68.7 68.5 68.3 68.1 68.2 68.4 2009 68.6 68.8 68.9 69.2 69.6 70.1 70.9 72.0 73.2 74.0 74.4 74.7 2010 75.4 76.4 77.3 78.1 78.9 79.5 79.9 80.4 82.5 85.8 88.3 90.2 2011 91.9 93.5 96.7 101.3 106.5 111.7 116.1 118.7 118.8 118.5 119.6 121.8 2012 124.7 127.2 127.3 126.2 124.3 121.6 119.9 119.5 119.2 119.5 120.5 120.5 2013 119.1 118.1 117.2 116.7 118.3 121.0 124.1 128.2 132.5 134.9 135.6 136.1 2014 137.5 138.9 141.1 143.9 145.1 145.8 145.4 142.9 140.3 138.7 137.6 137.4 2015 136.4 134.3 131.6 127.6 123.6 119.9 116.4 113.9 111.4 108.4 105.8 102.7 2016 99.8 98.0 96.5 95.1 93.1 90.4 87.8 85.7 83.9 82.7 81.3 80.2 2017 79.5 78.8 78.8 78.8 78.1 77.7 77.3 76.8 76.3 75.6 75.0 74.8 2018 74.3 73.6 72.1 70.6 70.2 70.0 70.0 70.0 70.1 70.3 70.5 70.3 2019 70.0 69.8 69.7 69.6 69.6 69.7 69.7 69.8 69.7 69.5 69.3 69.3 2020 69.5 69.8 70.1 70.5 71.6 73.0 73.8 74.1 74.5 75.0 75.5 76.2 2021 77.1 77.9 78.9 80.2 80.7 81.2 83.0 85.5 88.5 92.4 97.2 101.3 2022 104.7 108.4 112.1 115.9 119.2 122.4 127.3 133.0 137.4 139.8 141.4 144.3 2023 148.6 152.3 154.7 156.0 157.6 159.1 158.5 157.8 157.8 158.4 160.4 162.8 2024 164.7 169.5 175.1 180.2 185.4 189.0 191.9 193.4 194.3 194.7 192.4 187.8 2025 182.9 176.5 170.8 165.6 159.9 156.0 153.0 149.4 146.0 142.9 140.7 140.6 2026 141.5e142.1e142.0e142.7e143.9e144.1e143.8e144.2e144.9e145.8e146.5e145.9e 2027 145.1 141.7 138.2 134.6 130.8 126.7 123.1 120.3 117.4 114.2 111.0 107.9 2028 105.3 103.3 101.5 99.6 97.7 96.2 94.7 93.3 92.6 91.4 89.7 88.6 2029 88.0 87.2 86.5 85.7 85.0 84.2 83.1 81.5 79.9 78.7 78.2 77.9 2030 77.2 76.5 76.0 75.7 75.4 75.0 74.6 74.4 74.1 73.8 73.6 73.2 ============================================================================= The values in the smoothed sunspot number table are based on the observed (definitive and provisional) monthly mean sunspot numbers from WDC-SILSO, Royal Observatory of Belgium, Brussels (sidc.oma.be/silso/home). In June 2015, WDC-SILSO, Royal Observatory of Belgium, Brussels, adjusted their original observed sunspot numbers (Version 1.0) to a Version 2.0 series in which the sunspot numbers are higher. In the Version 1.0 data series, some of the sunspot numbers were weighted. The new (Version 2.0) sunspot numbers are unweighted sunspot number counts. The Bureau of Meteorology ASWFC solar cycle prediction is now based on the Version 2.0 values. The values in the smoothed 10.7 cm solar flux table are derived from daily 10.7 cm solar flux values adjusted to 1 Astronomical Unit (A.U.). The daily values are averaged to provide monthly mean values which are then smoothed. The 10.7 cm solar radio flux data are provided as a service by the National Research Council of Canada. In both tables, the observed monthly mean values are smoothed using a 13- month running filter (the values for the 1st and 13th months have half the weighting). Estimated values have an "e" suffix and are calculated from observed monthly and predicted smoothed numbers. Observed smoothed values precede the estimated values while predicted smoothed values follow the estimated values. If no estimated values are shown, all values are observed smoothed values and no prediction is shown. =============================================================================
(last updated 01 Jul 2026 10:36 UT)
OBSERVED MONTHLY SUNSPOT NUMBERS 2008 4.1 2.9 15.5 3.6 4.6 5.2 0.6 0.3 1.2 4.2 6.6 1.0 2009 1.3 1.2 0.6 1.2 2.9 6.3 5.5 0.0 7.1 7.7 6.9 16.3 2010 19.5 28.5 24.0 10.4 13.9 18.8 25.2 29.6 36.4 33.6 34.4 24.5 2011 27.3 48.3 78.6 76.1 58.2 56.1 64.5 65.8 120.1 125.7 139.1 109.3 2012 94.4 47.8 86.6 85.9 96.5 92.0 100.1 94.8 93.7 76.5 87.6 56.8 2013 96.1 60.9 78.3 107.3 120.2 76.7 86.2 91.8 54.5 114.4 113.9 124.2 2014 117.0 146.1 128.7 112.5 112.5 102.9 100.2 106.9 130.0 90.0 103.6 112.9 2015 93.0 66.7 54.5 75.3 88.8 66.5 65.8 64.4 78.6 63.6 62.2 58.0 2016 57.0 56.4 54.1 37.9 51.5 20.5 32.4 50.2 44.6 33.4 21.4 18.5 2017 26.1 26.4 17.7 32.3 18.9 19.2 17.8 32.6 43.7 13.2 5.7 8.2 2018 6.8 10.7 2.5 8.9 13.1 15.6 1.6 8.7 3.3 4.9 4.9 3.1 2019 7.7 0.8 9.4 9.1 9.9 1.2 0.9 0.5 1.1 0.4 0.5 1.5 2020 6.2 0.2 1.5 5.2 0.2 5.8 6.1 7.5 0.6 14.6 34.5 23.1 2021 10.4 8.2 17.2 24.5 21.2 25.0 34.3 22.0 51.3 37.4 34.8 67.5 2022 55.3 60.9 78.6 84.0 96.5 70.3 91.4 74.6 96.0 95.5 80.5 112.8 2023 144.4 111.3 123.3 97.6 137.4 160.5 160.0 114.8 134.2 99.9 107.1 113.5 2024 126.0 123.0 103.7 137.0 172.1 164.1 196.8 216.0 141.1 165.8 154.1 154.6 2025 137.0 155.7 134.2 141.4 78.5 114.6 125.9 133.7 129.7 114.8 91.7 124.2 2026 112.5 78.2 85.9 79.3 101.5 94.4
Although the prediction of solar cycles is difficult, it has practical applications. For example, in planning High Frequency (HF) communication links it is important to estimate what frequencies will be supported by the ionosphere well into the future. Predictions of sunspot number are also very important in planning space-related activities particularly for low Earth orbiting spacecraft.
Subscribe to the Bureau of Meteorology ASWFC solar indices mailing list to receive monthly updates of the observed and predicted smoothed sunspot numbers.
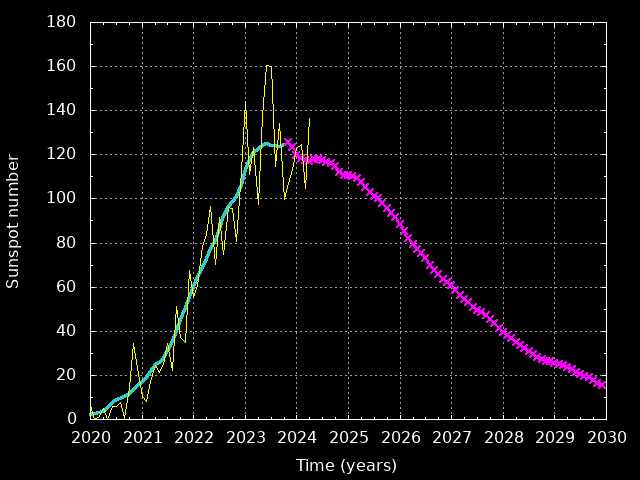
Below is a graph of the current solar cycle: observed monthly sunspot number (thin yellow), observed smoothed monthly sunspot number (thick turquoise) and predicted smoothed monthly sunspot number (magenta crosses). Graphs of previous solar cycles can be found here.
(last updated 01 Jul 2026 10:36 UT)
SOLAR CYCLE FORECAST ------------------------------------------------------------------------------- Cycle Solar_Min Solar_Max Max_SSN Cycle_Length Min_to_Max Max_to_Min Year Mth Year Mth Years Mths Years Mths Years Mths ------------------------------------------------------------------------------- 25 2019 Dec 2024 Oct 160.9 10.4 125 4.8 58 5.6 67
