Solar Wind Speed
Updates: every 10 minutes
(last updated 13 Jul 2025 06:47 UT)
Solar Wind Parameters Used: Date: 13 07 2025 0639 UT Velocity: 665 km/sec Bz: 6.0 nT Density = 3.0 p/cc Calculated Information from Solar wind parameters: Magnetopause Stand Off Distance = 11.3Re Solar Wind Dynamic Pressure Dp = 1.11nPa

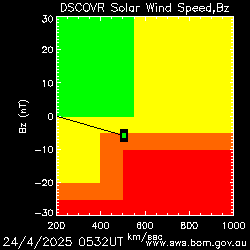
The above diagram indicates solar wind speed and strength of the interplanetary magnetic field (IMF) in a north/south direction. Higher solar wind speeds and strong south pointing (negative) IMF are associated with geomagnetic storms on earth. The red area on the image indicates an approximate region in which disturbed conditions might be expected.
The plots on this page were produced from data supplied by the US NOAA Space Weather Prediction Center (SWPC). This Real Time Solar Wind (RTSW) data set originates from NASA's Deep Space Climate Observatory (DSCOVR) satellite. The above image shows with a black square the value of the solar wind speed (horizontal) axis and the strength of the interplanetary magnetic field in a north/south direction (Bz - vertical axis). Higher solar wind speeds and strong south pointing (negative) interplanetary magnetic field are associated with geomagnetic disturbances on earth. The red area on the image indicates an approximate region in which disturbed conditions might be expected. The coloured dot within the black square, is an indicator of solar wind density, and is yellow when density exceeds 10 particles per cubic cm, red when density exceeds 15 particles per cubic cm, otherwise green.
The DSCOVR spacecraft is positioned at the L1 point between the Earth and the sun and gives approximately one hour advance notice of conditions on Earth. This typical lead time decreases with faster solar wind speeds associated with coronal mass ejections.
The solar wind magnetic field, can be measured in three compoenents, Bz, Bx, and By. Bx lies along the Sun-Earth line, with Bz and By defining a vertical plane (the clock "face"). The solar wind clock angle is the angle produced from the vector sum of By and Bz.
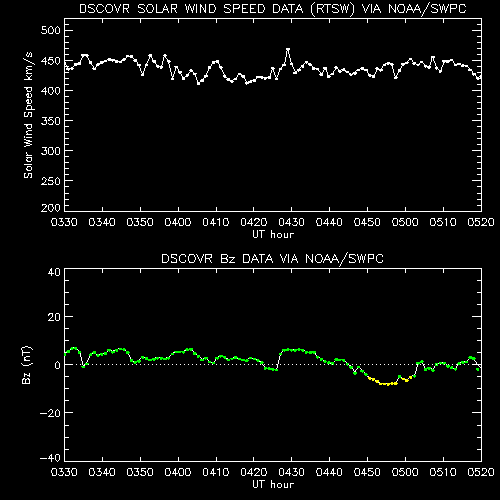
The image below shows recent trends in solar wind speed and interplanetary magnetic field north/south direction.


