


Imaging Riometer Information
Contents
Overview
The Southern Hemisphere Imaging Riometer Experiment (SHIRE) is an IRIS imaging riometer system which was installed at the Australian Antarctic station, Davis (68.58degS, 79.97degE geographic, -74.48deg Invariant latitude), over the Austral summer of 1996/97. The project is the result of collaboration between the Space Physics Group at the University of Newcastle, the Institute for Physical Science and Technology at the University of Maryland, and the Australian Antarctic Division.
A comprehensive description of the original IRIS imaging riometer (on which the SHIRE instrument is based) is given by Detrick and Rosenberg (1990), and further in the system manual for the IRIS. Only the major features of the instrument and its operation are described here.

Beam forming, beam orientation and configuration
The SHIRE instrument consists of a 64-element phased array of circularly polarised antennas (8x8). The signal received by the crossed-dipole (turnstile) antennas is fed into an eight-port Butler matrix, which is used as the beam-forming device. This configuration provides 49 simultaneous beams, covering a region, when projected onto the ionosphere, greater than 200km square at an altitude of 90km. The use of multiple narrow beams allows a spatial resolution of ~20km at 90km altitude, and the instrument samples all beams each 1s. The ionospheric projection (at 90km) of the 3db level of these beams is shown in Figure 1.
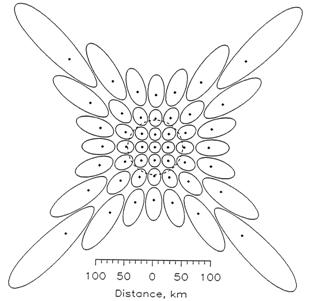
Figure 1: The projection of the -3dB contours of the 49 IRIS beams onto the ionosphere at 90km altitude. The point of maximum sensitivity of each beam is indicated by a dot. The dashed circle in the centre represents the nominal (-3dB) viewing area of a conventional broad-beam antenna.
See the SHIRE beam pattern antenna directivity parameters (or PDF).
An important characteristic of the IRIS/SHIRE instrument is the design of the antenna array and phasing system. The individual antenna elements are circularly polarised crossed-dipole (turnstile) antennas. Arrays of crossed-dipole antennas are able to generate beams in two dimensions with a single array. Each of the 64 antenna elements in the SHIRE 8 x 8 element array is positioned a quarter wavelength (1.96m) above the ground plane, and half a wavelength (3.927m) from its nearest (perpendicular) neighbour. One axis of the square array is aligned magnetically (compass) north-south. The ground plane, which is constructed of tensioned wire, extends a quarter of a wavelength past the array of antenna elements on all sides.
The beam-forming device is an eight-port Butler matrix which generates eight beams symmetric about the zenith in a meridional plane by means of a series of quadrature hybrid couplers and phase shifters. Each beam has a 12.8deg beamwidth at the -3dB point with about 15deg separation between beams (Figure 2). The largest side lobe is ~13dB below the peak of the zenithal beam (Detrick and Rosenberg, 1990).
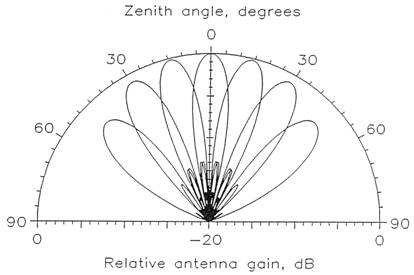
Figure 2: Antenna directivity patterns corresponding to the seven output ports of one IRIS Butler matrix. The largest side lobe is about 13dB below the peak of the zenithal beam (after Detrick and Rosenberg, 1990).
The standard Butler matrix combines the RF signals input from a series of antennas according to a specific series of steering phase increments. For an eight-port Butler matrix the signals from adjacent antennas are combined with a phase shift of one sixteenth of a wavelength. The basic matrix, however, has been modified in IRIS instruments to form a zenithal beam, facilitating comparison with zenithally-pointed broad-beam riometers. The modified beam pattern was achieved through the insertion of a progressive phase-shift of pi/8 between adjacent inputs to the Butler matrix. This modification resulted in the tilting of one beam to a horizontally pointing directivity (ie, an 'end-fire' beam), which is then terminated into a 50-ohm resistor.
Each of the eight rows of the antenna array are phased by a Butler matrix, with the seven outputs of each of these matrix boards coupled into a further series of orthogonal Butler matrix boards. Riometer receivers are connected to the seven second-level matrix boards and switched through the seven outputs of each board. Figure 3 is a schematic of the Butler matrix phasing assembly used for IRIS systems, reproduced from Detrick and Rosenberg (1990).
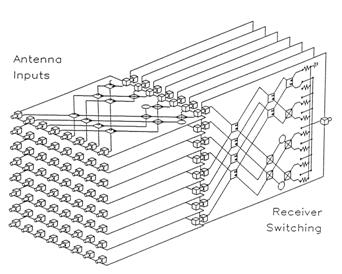
Figure 3: Schematic illustration of the Butler matrix phasing assembly used to provide the steering phases for beaming in two orthogonal directions. The antenna signals are input through the connectors on the left side of the diagram. The seven output ports of the matrix boards on the right (one switched output port per board) connect to the riometer receivers (after Detrick and Rosenberg, 1990).
This configuration allows beam forming in two orthogonal directions, and results in the formation of the 49
beams, as shown in Figure 1.
Control, timing and communications
Control of the phasing and data acquisition system is by an onsite microcomputer, which also controls switching through the seven beams on each of the output boards. Switching along the output ports is performed eight times a second, with no data transmitted during the last step of the cycle (corresponding to the terminated end-fire beam). This last step can be used to record data from a local RF noise generator for the purposes of calibration. The switching is such that each of the seven riometers has an observing sweep from the poleward horizon to the equatorward horizon every second.
Each riometer outputs a voltage signal proportional to the RF signal inputs. These output voltages are then digitised to 12-bit resolution using an integrating analogue-to-digital converter (ADC) connected to each riometer output terminal. The ADC integrates the output of a voltage-controlled oscillator (VCO) to produce a digital signal, which is then stored on the hard disk of a remote data acquisition PC.
Timing of the data acquisition and beam switching is achieved via a GPS/IRIG-B clock sub-system linked to one of the two serial ports of the data acquisition PC.
The entire phasing assembly and receiving system is housed in a temperature-regulated enclosure placed at the center of the array and kept at a constant 30degC, whereas the PC and timing block are housed in the science laboratory 400 metres away. Communications and data transfer between the PC and the clock and phasing controller sub-systems is via modems running at 9600 baud using standard RS-232 transfer protocol.
Summary of system parameters
This section summarises the major parameters of the SHIRE imaging riometer.
| Parameter | Value |
|---|---|
| Central Operating Frequency | 38.2 MHz |
| RF Bandwidth | 250 kHz |
| Max power consumption | 400 Watts |
Antenna
The antenna is a 64-element phased array of circularly polarised dipole elements (8x8).
| Parameter | Value |
|---|---|
| height off ground-plane | 1.96 +/- 0.01m (quarter-wavelength) |
| spacings (perpendicular) | 3.927 +/- 0.03m (half-wavelength) |
| orientation | one axis of square array magnetically N-S |
Phasing system
The phasing system is a 49-beam Butler matrix.
| Parameter | Value |
|---|---|
| beam width | 12.8deg full -3dB |
| beam separation | ~ 15deg |
| viewing area | ionospheric, >200 km square at 90 km height |
| resolution | 20 km (overhead beam) |
| image rate | 1 Hz |
| sensitivity | 0.05 dB |
Data acquisition system
Components of the data acquisition system are as follows.
| Component | Details |
|---|---|
| embedded controller | Intel 87C51 microcomputer |
| A/D converter | 12-bits, integrating |
| time base | dedicated GPS/IRIG-B clock |
| PC/controller connection | 9600 baud modems |
| PC acquisition system | Intel / MSDOS PC |
| PC acquisition software | PCIRIS |
Data storage
A hard disk drive is used for data storage.
| Parameter | Value |
|---|---|
| data file size | 1 hour = 307200 bytes at 12-bit resolution |
SHIRE Data processing
Riometry technique
Measurement of ionospheric absorption is achieved through a comparison of the radio noise signal at a particular sidereal time, and the signal level at the same sidereal time under 'quiet' ionospheric conditions (conditions of negligible absorption). A record of the signal level over one sidereal day under quiet conditions is termed the 'quiet day curve' (QDC). The difference between the QDC and the received power, after path length correction, is the equivalent absorption integrated along the ray path through the ionosphere. An apparent intensification of the radio signal through the ionosphere manifesting as a "negative absorption" event is taken as being due to interference, such as from solar radio emissions or scintillations of strong cosmic radio sources.
The operating frequency of SHIRE is 38.2MHz (HF-VHF frequency range, within the 37.75-38.25MHz protected frequency band reserved for radio astronomy). Typically, a standard (non-imaging) riometer is operated with a broadbeam antenna (beamwidth of ~60deg at the -3dB points), and with a single-lobe directional gain pattern (directivity). The riometer detects noise incident at the Earth through a directional antenna pointed skyward. Thus noise from terrestrial sources is rejected and the riometer responds mostly to extraterrestrial signals.
Further development of the riometry technique between 1984 and 1988 by the Institute for Physical Science and Technology of the University of Maryland (IPST/UMD) resulted in the design, development, and installation of the first 'imaging riometer'. IRIS (Imaging Riometer for Ionospheric Studies) was installed at the South Pole Scott-Amundsen base during the austral summer of 1987/88 to obtain two-dimensional images of CNA events. Detrick and Rosenberg (1990) give a full description of the IRIS instrument parameters and operation.
An imaging riometer differs significantly from the standard riometer in a number of ways. Most notably, a phased array of antennas is used to generate multiple narrow beams capable of producing two- dimensional images of the clouds of ionisation. Signals from each antenna in the array are fed into a central correlating unit, where they comprise the input to a Butler matrix which forms the multiple beams (Butler and Lowe, 1961). This results in a wider area coverage, at significantly enhanced spatial and temporal resolution. One obvious advantage of this higher resolution is more detailed information on the spatial structure and dynamics of auroras, and more significantly, an ability to distinguish between precipitation events of size anywhere between 20 and 200km.
Quiet Day Curve
Accurate determination of the quiet day curve is an essential part of the riometry technique. Over the history of riometry, numerous methods for determining the QDC have been devised (see Mitra and Shain, 1953; Heisler and Hower, 1967; Armstrong et al., 1977; Krishnaswamy et al., 1984). These include a least- square fit of the mass data plot for a given period (up to ~ 1 month) of the selected quiet-days cosmic noise values. Another technique involved a percentage criterion whereby the QDC was defined as the curve that separates the highest 10% of the data points in the distribution from the remaining 90%.
One of the most successful techniques is the inflection point method initially proposed by Armstrong et al. (1977) and later refined by Krishnaswamy et al. (1984). This method is the one currently in use for analysis of data from the SHIRE imaging riometer. The method involves setting the quiet-day signal as the voltage corresponding to the point of inflection on the high-signal end of the distribution curve of absorption measurements for the particular time interval (Figure 4). Krishnaswamy et al. (1984) show the maximum uncertainty involved in using this method to be 0.1dB, or less for low interference levels. They provide an in-depth analysis of this QDC method.
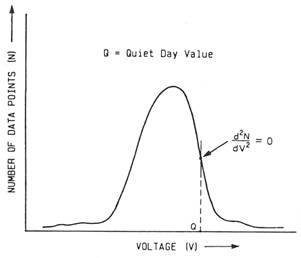
Figure 4: Inflection point method of determining the quiet day value (Q) from a distribution of data points (N) (after Krishnaswamy et al., 1984).
Just as the standard riometry technique (for single-beamed instruments) requires the derivation of a quiet-day curve as the zero point of all absorption measurements, it is equally necessary to derive 49 separate quiet-day curves for a 49-beam imaging riometer, using essentially the same method.
Discrete cosmic noise sources
One further consideration when using riometers concerns the assumption that the strength of cosmic noise signals reaching the Earth's upper atmosphere from a particular direction in space is constant. This assumption is not strictly true in all cases. Most importantly, when active sunspots are present on the sun, the sun's output at radio frequencies (~107 Hz) becomes notable. Under these conditions more sunward pointing riometer beams could suffer serious interference. Several other minor sources of variations in the cosmic noise level have also been identified. These are Jupiter, Venus, and also scintillations of discrete radio sources due to diffraction effects around irregularities in the ionosphere. Scintillations manifest as large, rapid fluctuations in received power localised usually to one beam of a narrow beam array. Their presence may indicate enhanced ionospheric irregularities. The scintillations in most cases average out for the diffuse background radiation, however, when a more intense discrete source such as the strong radio star Centaurus A is in the antenna beam, the scintillation of the received power may produce the observed interference. Scintillations are not usually seen in wide-beam riometers due to the large spatial integration of those instruments. The occurrence of scintillations in individual beams of a multi-beam instrument can to some extent be predicted through mapping of the 'star trails' of known radio sources onto the beam pattern of multi-beam riometers. This has now been incorporated into the SHIRE data analysis routines for automatic rejection of scintillating beams.
SHIRE data processing and analysis
A suite of programs have been developed using the Interactive Data Language (IDL) program for processing and analysis of SHIRE data. A number of existing IRIS IDL routines (courtesy T.J. Rosenberg, IPST, University of Maryland, USA) were also adapted for use in the analysis of SHIRE data. The typical output of SHIRE is an array of 49 voltage levels every second, written to a binary format data file. The resulting single-day data file is ~ 7 MB in size. SHIRE became operational in March 1997 and has operated almost continually since then. Data are transferred regularly back to the University of Newcastle (Australia) and the Bureau of Meteorology - Space Weather Services for archival in the WDC.
From the raw data, a QDC level is first calculated for the period of interest. The quiet day curves used in the analysis of SHIRE data are derived from 30 quiet days of data about the day of interest. Periods of excessive interference or large absorption events are identified and discarded during calculation of the QDC level. The data are binned according to sidereal time creating a histogram distribution for each bin. A Gaussian function is fitted to each of these distributions and the upper inflection point of this Gaussian is taken as the QDC level for that time.
Once the QDC is determined for each beam, raw data is converted from Volts to Decibels through comparison to this background level. A correction is made for the longer ionospheric path lengths traversed by radio noise detected in the oblique beams of the array.
The outputs of the basic suite of visualisation programs are as follows:
- an array of 49 'postage stamp' line plots of the absorption level in each beam arranged to reflect the geometry of the beam projection on the ionosphere.
- a time series of 2-dimensional images, with absorption represented by a colour intensity scale, constructed through bi-linear interpolation from a 7x7 data array to 49x49 pixel image at each instant in time. Often viewed as a movie of images in rapid sequence.
- a time series of absorption across one or multiple rows (columns), with absorption represented by a colour intensity scale. Commonly referred to as a 'keogram'.
Data availability
SHIRE has been operating at Davis Station near continuously since 1997. Throughout the SHIRE data archive there are short intervals of missing data due to operational reasons. The WDC SHIRE data availability page provides overview tables of the availability of SHIRE data in the WDC.
WDC Summary plots
WDC online summary plots of SHIRE data are unchecked, degraded-resolution summary plots,
not suitable for publication.
Data file format
SHIRE data is in standard IRIS format. This is a proprietary format for IRIS imaging riometer systems designed by the University of Maryland.
Basic read programs for IRIS format SHIRE data are available on request. The read programs are written in IDL (RSI Interactive Data Language).
SHIRE Data policy (Rules-of-the-road)
SHIRE data may be used for scientific purposes in line with a set of data useage Rules of the Road (or PDF).
WDC online summary plots of SHIRE data are unchecked, degraded-resolution summary plots,
not suitable for publication.
More information