


Global 30-day Climatology
Your browser has javascript disabled. With javascript enabled you would see control buttons here to enable viewing up the last 3 days of TEC map images interactively.
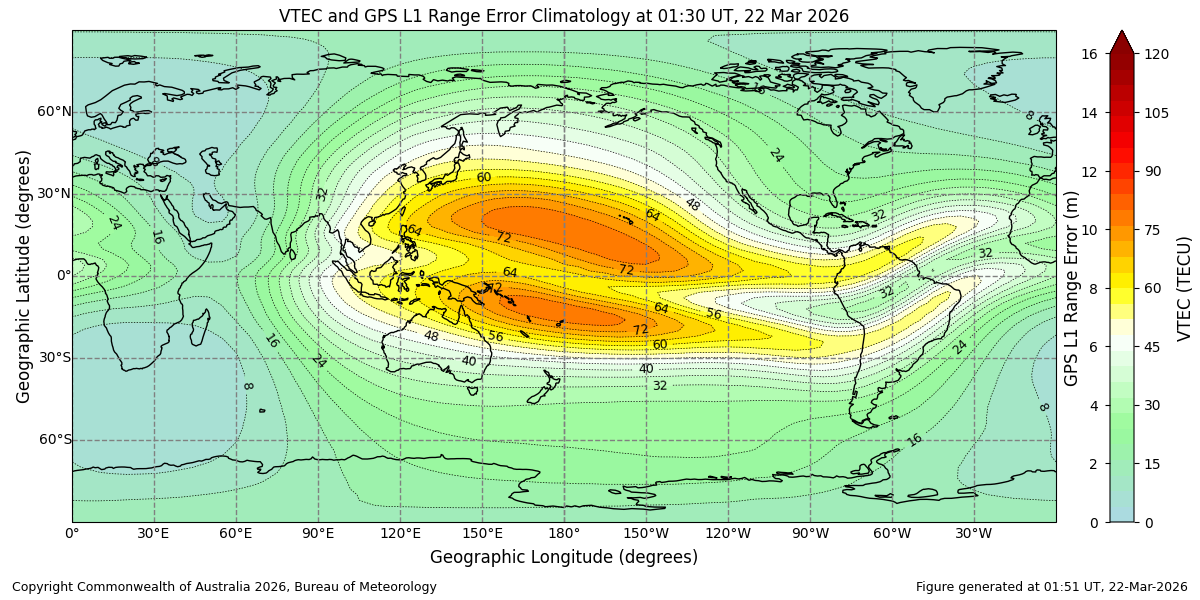
This map displays recent climatological vertical Total Electron Content (VTEC), generated by the ASWFC using the previous 30 days of VTEC model simulations. Please note that data from the current Universal Time (UT) day is not included. VTEC values are simulated using the International Reference Ionosphere (IRI-2020) model, with the foF2 STORM model option enabled. The model is constrained using observed space weather parameters, including daily F10.7 solar flux, sunspot numbers, the estimated Ap magnetic index, and three-hourly ap indices.
The map is produced by gridding the VTEC data and calculating the median value at each time of day over the 30-day period. This method provides a baseline climatology that naturally adjusts for seasonal variations and solar cycle effects, representing typical undisturbed ionospheric conditions. By comparing this baseline with current observations, we derive the VTEC disturbance map. One TEC unit (TECU) equals 1016 electrons per square metre. The GPS L1 range error is directly proportional to the amount of TEC along the signal’s path.
