


Global Disturbance Map
Your browser has javascript disabled. With javascript enabled you would see control buttons here to enable viewing up the last 3 days of TEC map images interactively.
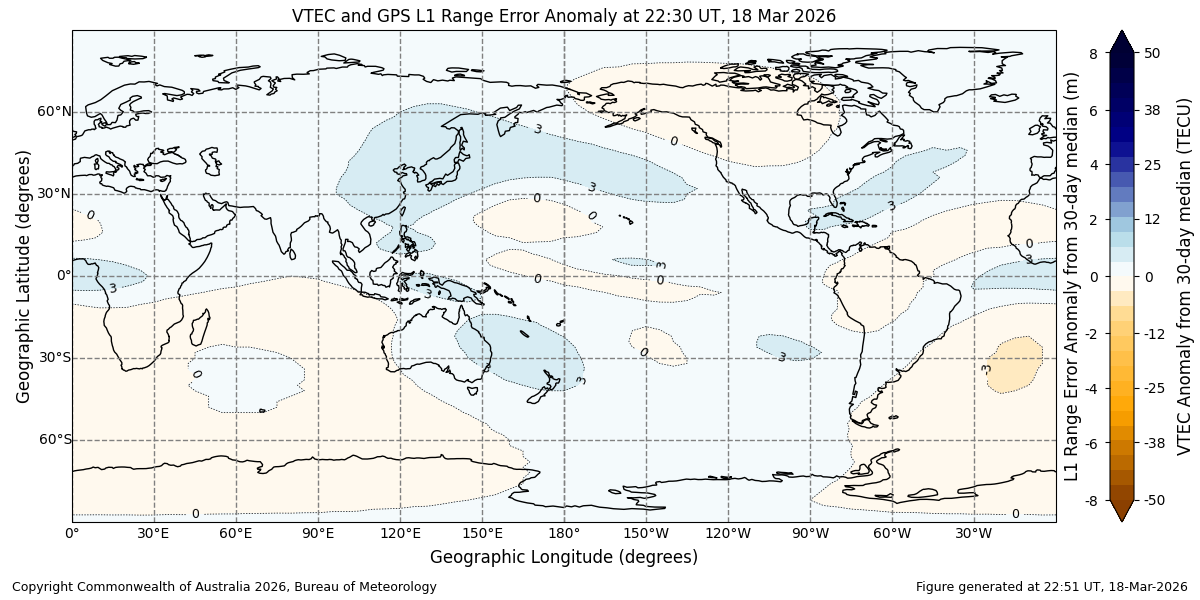
The near-real-time ionospheric VTEC (vertical Total Electron Content) and GPS L1 range error disturbance map is produced by the ASWFC by subtracting a dynamically updated recent climatology map from the current ionospheric conditions. This highlights deviations from average ionospheric behaviour for the current time, day, season, and solar cycle.
The disturbance map shows colour contours of VTEC anomaly in units of TECU (1016 electrons/m2) and GPS L1 range error anomaly in units of metres (m). The data on this map can be used to qualitatively determine whether the ionosphere is mildly enhanced (blue), strongly enhanced (dark blue), mildly depressed (orange), strongly depressed (dark orange), or near average monthly values (white).
