


Hourly HAP Charts
These are Hourly Area Predictions (HAP) of communication frequencies based on current observed conditions in the Australasia ionosphere. Because of the variability of the ionosphere this type of prediction can only be made for the current hour.
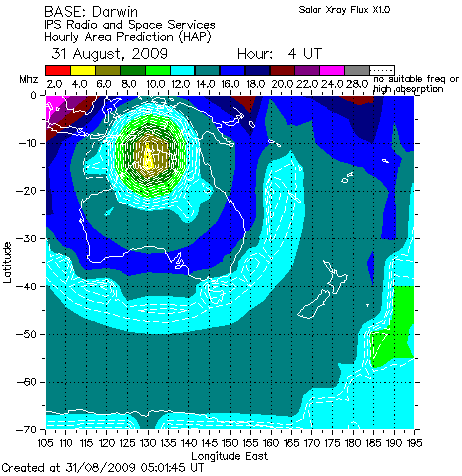
During daylight hours the absorption limiting frequency is increased by solar xray flares. The near real time hourly HAP charts will show an empirical model estimate of the flare increased ALF, during the local day, if there is a flare in progress at the time the chart was created.
See an example HAP chart for Darwin with a prediction of flare enhanced absorption limiting frequencies overplotted. The ALF prediction was made for a solar xray flare of X1 magnitude, shown as dashed white line contours over the HAP chart.
