


Ionospheric Map
The last 7-days ionospheric conditions as observed by a global network of ionosondes is shown on this page.
Updates: Every 15 minutes
Your browser has javascript disabled. With javascript enabled you would see control buttons here to enable viewing up the last 7 days of ionosperic maps images interactively.
Selected map: Ionospheric Map
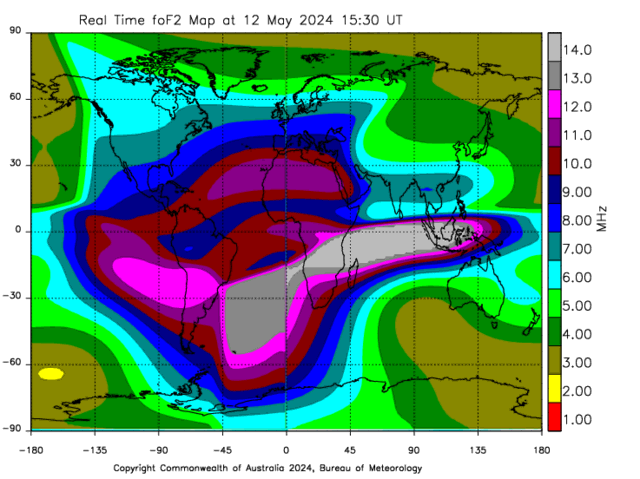
The plot above shows a near real-time critical ionospheric frequency (foF2) map produced using automatically scaled ionogram profiles from the Australian region and around the world. The last 7 days of maps can be viewed using the control buttons underneath the above image.
The map shows colour contours of foF2 in units of MHz.
How to use this tool
- Choose the type of map using the drop-down list located above the graph.
- To animate, first select the display duration using drop-down list located below the graph and then press "Load Animation" button. The user can also choose different speeds of animations.
- To view still images during a playing, press "Pause" button and then use the navigation buttons located below the graph to switch between images.
Data Providers for the World Ionospheric foF2 Map (updated every 15minutes)
The data presented in this page are derived from the automated interpretation of ionograms from around the world. Regional data are obtained from the Space Weather Network (SWN), formely known as IPSNET, (Australia Pacific Region). Global data are obtained from the NICT Space Weather Information Centre of Japan (Japanese region), the Space Physics Group at Rhodes University's Hermanus Magnetic Observatory (South African region), the Istituto Nazionale di Geofisica e Vulcanolgia, Rome, Italy (Italian Region), the Facultad Regional Tucumn, Universidad Tecnolgica Nacional, Argentina, (South American Region), the Global Ionospheric Radio Observatory (GIRO), and the United States of America Space Weather Prediction Centre (SWPC). The ionospheric data available from the SWPC and GIRO are contributed by the International Space Environment Service's (ISES) Regional Warning Centres (RWCs) located around the globe, the United States Air Force (USAF) and several research institutes.
Validation checking
Most of the station foF2 data used to create the above map are obtained from the sites listed below. If you wish, you can compare the map contour values at station locations with these station data files and ionograms.
- Global Ionospheric Radio Observatory at University of Massachusetts Lowell Center for Upper Atmospheric Research.
- Ionospheric station of Tucuman in Argentina.
- Institute of Space Applications and Remote Sensing, National Observatory of Athens in Greece.
- Rutherford Appleton Laboratory (Ionosondes Group) in England
- Istituto Nazionale di Geofisica e Vulcanologia in Rome
- RWC Warsaw Helio-Geophysical Predictions Service in Poland
- IZMIRAN, Russian Academy of Science in Russia
Application
The above map can be used as a guide to NVIS ionospheric frequency support and to generate real time HF predictions (eg Hourly HAP charts) to assist the HF radio communicator.
A feature of the ionosphere is its ability to reflect radio waves. However, only radio waves within a certain frequency range will be reflected and this range varies with a number of factors.
The most widely used instrument for ionospheric measurement is the ionosonde. The ionosonde is essentially a high frequency radar which sends short pulses of radio energy into the ionosphere. If the radio frequency is not too high, the pulses are reflected back to earth.
The ionosonde records the time delay between transmission and reception of the pulses. By varying the frequency of the pulses (typically 1-22MHz), a record is obtained of the time delay at different frequencies. This record is referred to as an ionogram.
The highest (see note) frequency which the ionosphere will reflect vertically is called foF2. These foF2 measurements from various sites can be used to create a map of foF2.
Note: The geomagnetic field splits a radio wave in the ionosphere into two separate components, termed the ordinary (o) and extraordinary (x) waves. It is the o-wave which is routinely scaled from ionograms.
