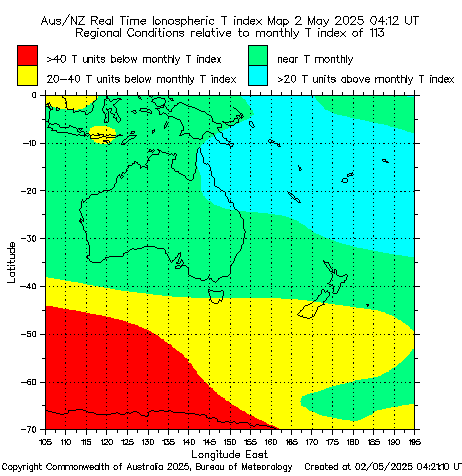
T Index Map
The map below shows the difference between current observed hourly conditions and predicted monthly conditions for the Australian region. Depressions and enhancements are with respect to the SWS predicted monthly T index for that month.

Note:The map is updated every 5-minutes, using Space Weather Network data typically from last 10-15minutes.
Colour legend
| Colour | Conditions |
|---|---|
| blue | enhanced |
| green | normal |
| yellow | mildly depressed |
| red | depressed |


