


Current foF2 Plots
These are graphs of autoscaled foF2 against monthly predicted foF2 values. These values are based on the automated interpretation of ionograms received each hour.
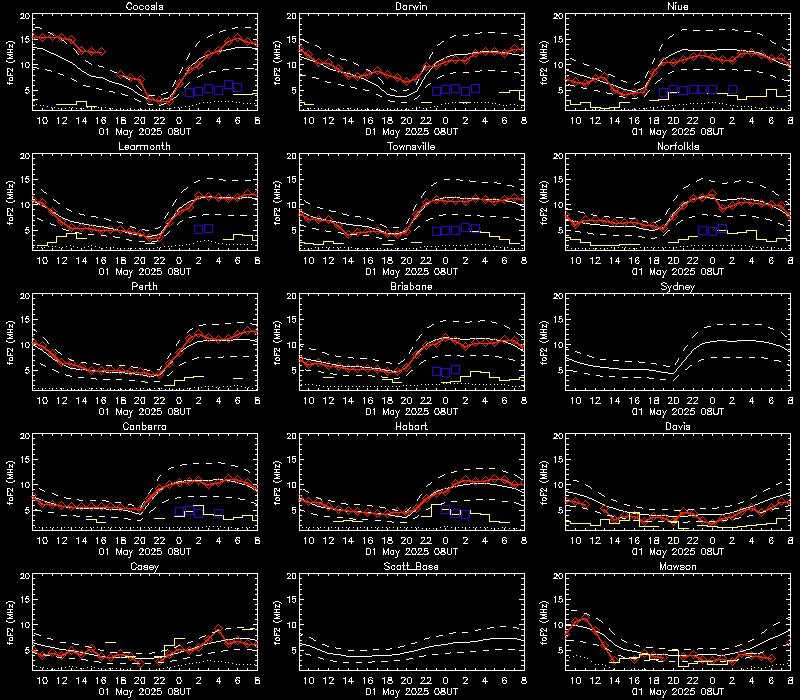
Legend
- White solid line indicates monthly predicted foF2.
- White dashed line indicates monthly predicted foF2 +/- 30%.
- Red solid line indicates hourly observed (autoscaled) foF2 from that station.
- Yellow solid line indicates sporadic E (foEs).
- Blue squares indicates hourly autoscaled foF1 from that station.
