


The Leonid Meteor Storm of 2001
Introduction
Predictions by several groups around the world suggested that the Leonid meteor shower in 2001 would be a spectacular sight with corrected visual meteor rates in excess of 1000 meteors per hour. These predictions proved amazingly accurate with regard to peak times, and only somewhat exaggerated in actual rates. Two peaks were in fact observed, one over the Americas and one over East Asia. Both of these were meteor storms with corrected Zenithal Hourly Rates (ZHR's) in excess of 1000 per hour.
The Leonid meteor shower is an annual shower that occurs between the 14th and 20th of November. It is the result of debris left behind by the passage of Comet Tempel-Tuttle as it moves in its orbit about the Sun. This orbit has a period of 33 years, and every 33 years or so the Earth passes through a larger than normal debris cloud from this comet.
The Leonids are so called because all the meteors from this shower appear to come or radiate from a point in the Constellation of Leo the Lion. This point is called the radiant of the meteor shower. Only when this point lies above the horizon are Leonid meteors visible.
Leonid meteors have the highest velocity of any common meteor shower. They are travelling at around 70 kilometres per second when they hit the Earth's atmosphere, and so they appear to be moving a lot faster than most other meteors seen in the night sky.
Observations of the Leonids were made at Learmonth Solar Observatory in 2001 by visual observers and also with a SKiYMET meteor radar. These are discussed in the sections following, together with an analysis of the information gathered.
Leonid visual observations
For Australia the Leonid radiant rises at about 1:30 am local time. By 4:30 am the sky is becoming too light for visual observations, so there is a visual observation window of about 3 hours during which Leonid meteors may be seen.
David Glackin from The Aerospace Corporation (California, USA), Michael Pique from The Scripps Research Institute (California) and John Kennewell (ASWFC, Learmonth) conducted visual and photographic observations from the 17th through 19th of November.
The meteor rates from these observers is presented below:
| Date | Time (UT) | Count | Corrected ZHR | Observer |
|---|---|---|---|---|
| 17 Nov | 1900-2000 | 6 + 8S | 12 +/- 5 | JK |
| 18 Nov | 1715-1730 | 11 | 3372 | DG |
| 18 Nov | 1730-1745 | 48 | 2944 | DG |
| 18 Nov | 1745-1800 | 79 | 2172 | DG |
| 18 Nov | 1800-1815 | 62 | 1528 | DG |
| 18 Nov | 1815-1830 | 80 | 1512 | DG |
| 18 Nov | 1830-1845 | 101 | 1568 | DG |
| 18 Nov | 1845-1900 | 102 | 1340 | DG |
| 18 Nov | 1900-1915 | 100 | 1144 | DG |
| 18 Nov | 1915-1930 | 84 | 860 | DG |
| 18 Nov | 1930-1945 | 114 | 1070 | DG |
| 18 Nov | 1945-2000 | 77 | 664 | DG |
| 18 Nov | 1830-1900 | 167 + 5S | 1170 +/- 60 | JK |
| 18 Nov | 1900-1930 | 175 + 3S | 910 +/-50 | JK |
| 18 Nov | 1930-2000 | 155 + 3S | 650 +/- 40 | JK |
| 19 Nov | 1900-2000 | 6 + 17S | 12 +/- 5 | JK |
Notes
- The number under Count is the actual (raw) number of meteors counted in the time interval specified. The first number refers to the number of Leonids. The +nS refers to the number of sporadic meteors counted in addition to the Leonid count.
- The +/- error in the ZHR is the standard deviation of the corrected ZHR assuming a Poisson distribution.
- Correction was made for the elevation of the radiant. It was assumed, fairly accurately that the limiting sky magnitude at the site lay close to 6.5 . DG made a 7% correction for time spent in recording. JK used computer recording which allowed a 100% temporal coverage of the sky.
- The count by DG from 1715-1730 were Earth grazing meteors that extended over many tens of degrees - the radiant was just rising during this time, and the corrected ZHR has a large error estimate.
The following sections contain observational comments from the observers.
Dave Glackin
18 November
- We had quite a Leonid show here on the NW Cape of Australia, observing from the grounds of the Learmonth Solar Observatory. Many of the early meteors that were observed as the radiant rose were earth grazers that passed nearly overhead, moved relatively slowly, and traversed much of the sky. They had distinct reddish- orange heads and whitish trails. During the shower, a few fireballs were seen in various hues of blue and green. Three left behind long-lived trains. There were also several meteors that demonstrated terminal bursts, some extremely bright (one was bright enough to reflect off of the Exmouth Gulf). Meteors came in bursts, and at least twice I observed half a dozen meteors in the space of about 2 seconds. Many triple bursts (three meteors nearly simultaneously) were seen.
- The sky was very dark and mostly cloud-free. There were some low clouds in thin layers near the horizon, and occasionally what appeared to be thin cirrus higher in the sky. Meteors were readily visible either between the thin layers or through the cirrus, and I have made no correction for this.
- Dave Glackin, Senior Staff, The Aerospace Corporation, Los Angeles, CA, 310-336-8735, David.L.Glackin@aero.org
John Kennewell
17 November
- The Leonid count was lower than expected at this time. Four of the observed Leonids had short duration trains. The most interesting Leonid at 19:53 UT was about magnitude -2, 30 degrees in length and had a train of about 3 seconds duration.
18 November
- Certainly a spectacular night. At around 0130 LT (1730 UT), long grazing meteors started to appear before Leo could be seen on the horizon. A few clouds on the horizon did not distract from the view (clouds covering only about one percent of the sky). The sky was dark with a limiting magnitude of about 6.5. Accurate counts were made only from 1830 UT until 2000 UT. Astronomical twilight started not soon after this.
- The majority of Leonids had trains of short duration but three had trains exceeding one minute.
- Many Leonids had magnitudes brighter than zero, with several fireballs (mag < -4). The initial numerous grazing meteors which heralded the storm around 01:30 local time produced some of the most spectacular sights of the morning, with travels in excess of 90 degrees. Sometimes the meteor would appear to fade out and would then flare again after 10 or 20 degrees of travel. Short trains accompanied many of these meteors as they did throughout the observing period.
- It will be noted that the hourly count rate remained relatively constant throughout the night, although this implies a decreasing corrected zenithal hourly rate due to the increasing elevation of the radiant.
- On many occasions meteors appeared to be clumped together in time, and several times the close appearance of two or more meteors along almost identical tracks must have indicated that these came from a single original parent.
19 November
- All major Leonid activity is obviously over by this time. The Leonid count is in fact identical to that observed on the 17th. Four of the six Leonids had short duration trains. One was brighter than magnitude -2.
- The sporadic meteor count is unusually high, but no specific radiants were identified among this group.
Radiant Look Angles
The table below indicates the look angles for the Leonid radiant during the 18th of November. The columns headings are abbreviated as follows.
- UT - Universal Time
- LST - Local Sidereal Time
- LHA - Local Hour Angle (hours)
- Elev - Radiant Elevation (degrees)
- Azim - Radiant Azimuth (degrees)
- ZHRcorr - Elevation component correction to raw count to give ZHR
Other details:
- Radiant (Leonids): declination 21.2 degrees, right ascension 10.3 hours
- Observer (Learmonth): latitude -22.2 degrees, longitude 114.1 degrees
| UT | LST | LHA | Elev | Azim | ZHRcorr |
|---|---|---|---|---|---|
| 17:30 | 05:00 | -5.29 | 1.3 | 66.4 | 43.8 |
| 18:00 | 05:30 | -4.79 | 7.6 | 63.3 | 7.5 |
| 18:30 | 06:00 | -4.28 | 13.8. | 59.9 | 4.2 |
| 19:00 | 06:31 | -3.78 | 19.7 | 55.9 | 3.0 |
| 19:30 | 07:01 | -3.28 | 25.3 | 51.3 | 2.3 |
| 20:00 | 07:31 | -2.78 | 30.6 | 46.0 | 2.0 |
| 20:30 | 08:01 | -2.27 | 35.3 | 39.8 | 1.7 |
| 21:00 | 08:31 | -1.77 | 39.5 | 32.7 | 1.6 |
| 21:30 | 09:01 | -1.27 | 42.8 | 24.5 | 1.5 |
| 22:00 | 09:32 | -0.77 | 45.2 | 15.3 | 1.4 |
| 22:30 | 10:02 | -0.26 | 46.4 | 5.3 | 1.4 |
| 23:00 | 10:32 | 0.24 | 46.5 | 355.1 | 1.4 |
| 23:30 | 11:02 | 0.74 | 45.3 | 345.2 | 1.4 |
| 00:00 | 11:28 | 1.18 | 43.3 | 337.1 | 1.5 |
| 00:30 | 11:58 | 1.68 | 40.1 | 328.7 | 1.6 |
| 01:00 | 12:29 | 2.19 | 36.1 | 321.3 | 1.7 |
| 01:30 | 12:59 | 2.69 | 31.4 | 315.0 | 1.9 |
| 02:00 | 13:29 | 3.19 | 26.3 | 309.6 | 2.3 |
| 02:30 | 13:59 | 3.69 | 20.7 | 304.9 | 2.8 |
| 03:00 | 14:29 | 4.20 | 14.8 | 300.8 | 3.9 |
| 03:30 | 14:59 | 4.70 | 8.7 | 297.2 | 6.6 |
| 04:00 | 15:30 | 5.20 | 2.4 | 294.1 | 23.5 |
Summary of Leonid Visual Observations
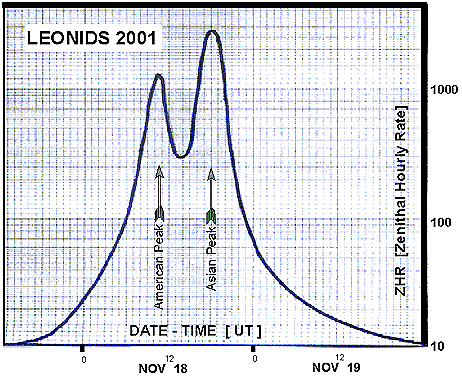
The graph below is a smoothed representation of the Leonid Zenithal Hourly Rate as derived from observations at Learmonth and those published by the International Meteor Organisation www.imo.net. As predicted, the first peak occurred around 1030 UT and was visible to observers in the Americas. The second peak around 1800 UT was visible in the Asian and Australasian region. It might be noted that the maximum peak for this 2001 Leonid storm was less than that seen in the 1999 Leonid storm (which rose above 5000), but the time during which the ZHR was at storm levels (defined as exceeding 1000) was greater in 2001 than in 1999.
SKiYMET radar observations
Installation
The SKiYMET meteor radar is manufactured in Adelaide by Genesis Software in a joint operation with Mardoc, Inc (Canada). The Genesis Software web site www.gsoft.com.au provides an excellent introduction to the radar and services provided by Genesis.
Brian Fuller, the CEO of Genesis proposed a Leonid campaign deployment of a SKiYMET radar at Learmonth to ASWFC earlier in the year, and this was gratefully accepted.
Brian Fuller and Daniel O'Connor from Genesis Software in Adelaide arrived at Learmonth on Wednesday (Nov 14th) to commence installation of the SKiYMET meteor radar which had arrived in crates the day before.
Wednesday afternoon was spent unpacking the crates and setting up the equipment. Thursday was spent erecting the transmit and receive antennae, as well as establishing a network connection through the ASWFC data line to Sydney.
On Friday morning Adrian Murphy joined the team, and all antenna tuning was completed. The radar was put on the air at full power on Friday afternoon. Attention to transmit antenna alignment resulted in very low RFI to the Solar Radio Spectrograph and confirmed that 24 hour operation would be possible. Unfortunately, high levels of ionospherically propagated signals from Asia in the afternoon hours caused some degradation of the meteor detection process during this interval. This did not interfere with Leonid observations - the Leonid radiant being above the local horizon from about 0130 to 0400 local time (1730 to 0400 hours UT).
Meteor Science
The software processor on the SKiYMET radar is presently configured only to detect what are referred to as underdense meteor radar echoes. This is a term that is very significant in meteor radar studies. An underdense meteor is one that has a linear ionisation density sufficiently low that the radio/radar signal can penetrate the ionised column, and where each electron thus acts as a separate or independent scattering centre. By contrast, an overdense trail has so many electrons per metre of trail that the radar signal cannot penetrate the column but is reflected from the boundary or edge of the trail. The ionised trail in this instance acts as if it were a miniature ionosphere. The transition density between underdense and overdense trails lies at around 10-15 electrons per metre.
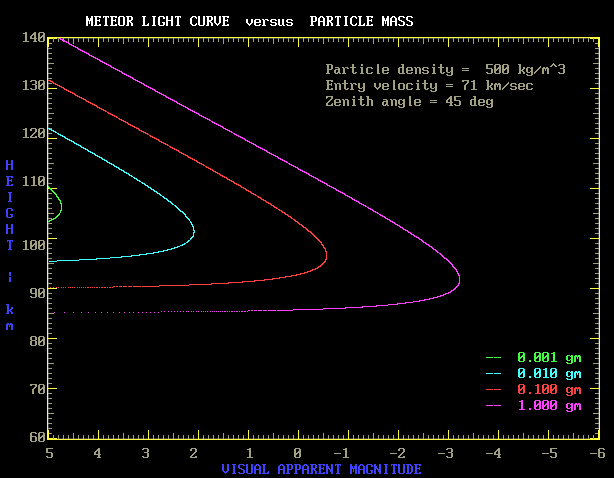
This equates to a visual magnitude of around 5. Thus most of the meteors detected by the radar are too small to produce a visible meteor. It is interesting to perform a numerical simulation of meteor ablation in the atmosphere using theory that was originally derived by Ernst Opik. By substituting parameters that we believe are appropriate for the Leonid meteors we can roughly determine what mass meteoroids give rise to what magnitude visual meteors and what altitudes.
The graph below depicts the light expected for typical Leonids with parent masses ranging from 0.001 to 1.0 grams. The high entry velocity and low density of the Leonids both act to produce light curves that give peak brightness (and also greatest ionisation - relevant to a meteor radar) at higher altitudes than the majority of meteors. It can be seen that the SKiYMET meteor radar essentially detects meteors whose parent mass is less than one thousand of a gram, and at heights mostly above 100+ km.
SKiYMET Data
The following three graphs indicate basic parameters of the meteor flux measured by the SKiYMET radar on 17, 18 and 19 November respectively.
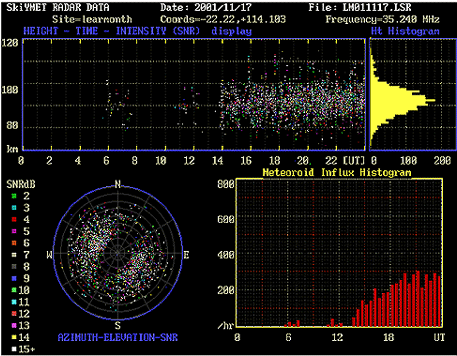
The radar was not operating in the early morning hours. Note the high altitude meteors detected after 1730 UT. These are mostly Leonids.
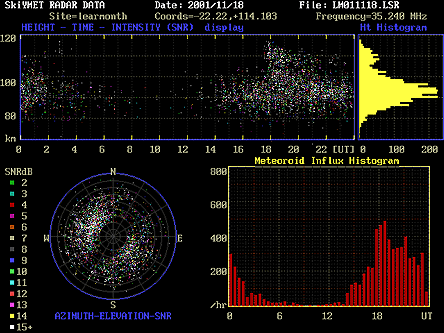
The Leonid storm is very apparent in this plot, on the Influx Histogram, where there is a sudden jump in rate after 1730 UT, when the Leonid radiant has just risen, but most particularly in the Height-Time-Intensity graph where the number of meteors detected at altitudes in excess of 105 km is very pronounced. This is also seen in the secondary peak around 110 km that can be seen in the Height histogram.
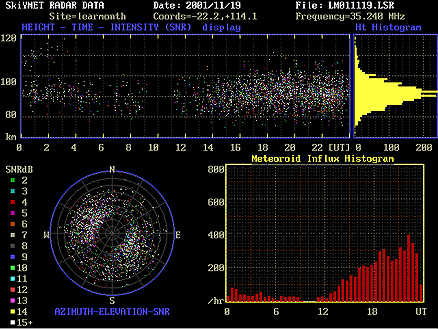
Note the sprinkling of high altitude meteors from 0000 UT to 0400 UT at which time the radiant has set. However, there are almost no high altitude meteors detectable when the radiant rises again at 1730 UT. By this time, practically all Leonid activity has ceased.
One of the problems with the above displays is separating out Leonid meteors from the reasonably large sporadic background. This is not a problem with visual observations for two reasons. Firstly, it is possible to see whether the meteor track extends back to the radiant, and secondly, the sporadic background is much lower for the brighter (visual) meteors. However, it is possible to see the drastic rise in meteors detected at the higher altitudes. Above 104 km, most of the meteors are Leonids. The following plot shows flux of meteors detected by the SKiYMET radar over 3 days, from the 17th to the 19th of November inclusive.
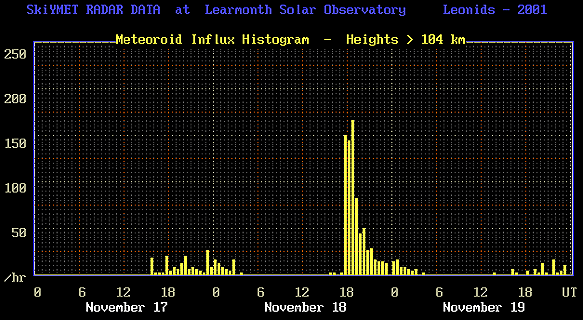
Note the few meteors on the 17th, the spectacular rise of the rate just after 1730 UT on the 18th, and the lack of significant activity on the 19th, when practically all of the Leonid activity has ceased.
The SKiYMET radar also has the capability to measure the velocity of a small number of well-defined meteor echoes. The following plot for the 17th shows the meteor population broken down into three categories (speed undetermined, speed >40 km/sec [fast] and speed <=40 km/sec [slow]).
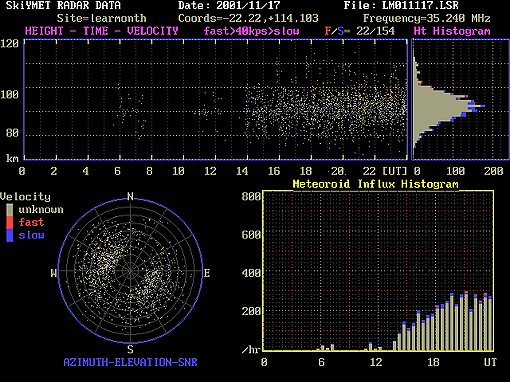
Note that the fast meteors generally are detected at the higher altitudes, and generally after 1730 UT, when the Leonid radiant has risen.
Because the number of meteors whose entrance velocity can be accurately determined is very small compared to the population of total meteors detected, it is more instructive to look at the ratio of fast to slow meteors over the days in question.
| Date | F/S Ratio |
|---|---|
| 17th | 22/154 = 0.14 |
| 18th | 58/214 = 0.27 |
| 19th | 18/184 = 0.10 |
| 20th | 22/203 = 0.11 |
The preponderance of the fast ( 70 km/sec) Leonids can be seen very clearly on the 18th.
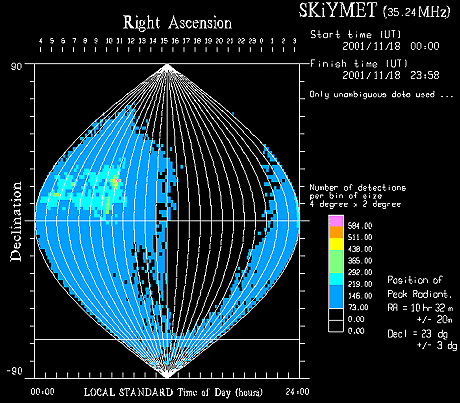
The SKiYMET radar can also determine the radiant of each meteor, and the Leonid radiant is shown very clearly in the following image.
Acknowledgement
Sincere thanks to Brian Fuller and all at Genesis Software for the opportunity to host a SKiYMET Radar at Learmonth Solar Observatory.
Summary
The Leonid meteor shower of 2001 rose to storm levels on two separate occasions on November 18 (UT), indicating the passage through two separate debris streams left by the passage of the comet Tempel-Tuttle in past orbits. Although the observed meteor influx rates were a little below those predicted, the times of the peaks were forecast quite accurately. This accuracy, repeated from past years, probably indicates that existing models are now matching reality very well.
Radar observations, when taken with the visual rates, indicate that the Leonid shower is very rich in brighter meteors, and that the shower has a mass exponent which is much closer to one than the value of 2 generally derived for sporadic meteors. The mass exponent s appears in the formula N(m) = k m-s where N is the number of meteors expected with a mass m (k is a constant of proportionality). A high value of s implies that there are considerably more smaller meteors than there are larger ones. A value s=1 would imply equal numbers of meteors in each mass range. The actual value of s will depend on the size range of particles that are initially dispersed from the comet in its passage near the Sun, and then upon the evolution of those particles in their subsequent orbits. Collisions between particles tend to produce a greater number of smaller particles, but if the stream has been around for a long time, there are non-gravitational forces that tend to remove the smaller particles from orbit. It is believed that the peaks of activity seen this year are from particles released by the comet in orbits within the last 200 years or so. In this case we expect the particle size distribution to closely represent the distribution of the particles initially released from the comet, due to the very short time(astronomically speaking) available for any subsequent interactions.
Material prepared by Richard Thompson
