


Space Weather and Radio Communications
In the darkness of space between the Sun and Earth, electromagnetic radiation from radio waves to gamma-rays as well as high energy charged particles stream constantly toward the Earth. Meanwhile, in the rarefied upper atmosphere of the Earth far above the highest clouds, magnetic storms rage and howling winds drive atmospheric currents around the globe. Conditions in the Earth's upper atmosphere and further out into space, driven by powerful emissions from the Sun, are referred to as "space weather".
Underlying space weather is the Sun, the output of which varies over an 11 year cycle. Conditions in the upper atmosphere vary greatly at different points on the globe with the change in the zenith angle of the Sun, just as with the "regular" weather on the surface of the Earth. Conditions also vary throughout the day and night and with the seasons. For the radio frequency communicator, managing the effects of space weather is essential to achieving reliable communications 24 hours a day.
Frequencies in the High Frequency (HF: 3 - 30 MHz) band are particularly sensitive to space weather. HF, which is suited to radio communications over very long distances, is important for defence forces, emergency services, remote broadcasters, aviation and marine operators. Communications from VLF to satellite are also affected by space weather making its prediction and the understanding of its effects invaluable.
Solar Activity and the Ionosphere
HF radio, which can be effective over extremely long distances, utilises a portion of the upper atmosphere known as the ionosphere. The ionosphere, which reflects HF radio waves, is created by solar radiation and is a part of the space weather environment. The ionosphere extends from around 50 km to 500 km in altitude and is characterised by the presence of free electrons which can refract (bend) and sometimes reflect radio waves back to Earth. The greater the density of free electrons, the greater the frequency of radio waves that can be reflected.
The free electrons in the ionosphere result from ionisation of atoms and molecules by solar radiation. Variations in chemical composition and atmospheric dynamics lead to the formation of a number of distinct bands or layers. These regions of particularly high electron density are labelled in order of increasing height as the D, E, F1 and F2 regions.
The F2 region (sometimes just called the F region), stretching from 200 km to 500 km in altitude is the most important part of the ionosphere for radio communicators. It is highest in altitude and thus provides the greatest communication range. It also reflects the highest frequencies, which is vital since absorption (attenuation) of HF decreases with increasing frequency. It is also the only layer that is ionised sufficiently to reflect HF both day and night. The lowest part of the ionosphere, the D region, is also very important as it attenuates rather than reflects radio waves.
With the coming of night and the absence of solar ionising radiation, the electron density in the D, E and F1 regions becomes very low. The electron density of the F2 region is also reduced at night but persists in a weakened state due to winds in the upper atmosphere which carry electrons from day-side to night-side. Thus, reflections from the night-side ionosphere occur only from the F2 region (called the F region at night).
Both the D and F regions of the ionosphere are highly sensitive to variations in space weather and solar activity. The interaction of HF radio waves with the D and F regions varies greatly with the seasons, throughout the day and night and throughout the solar cycle.
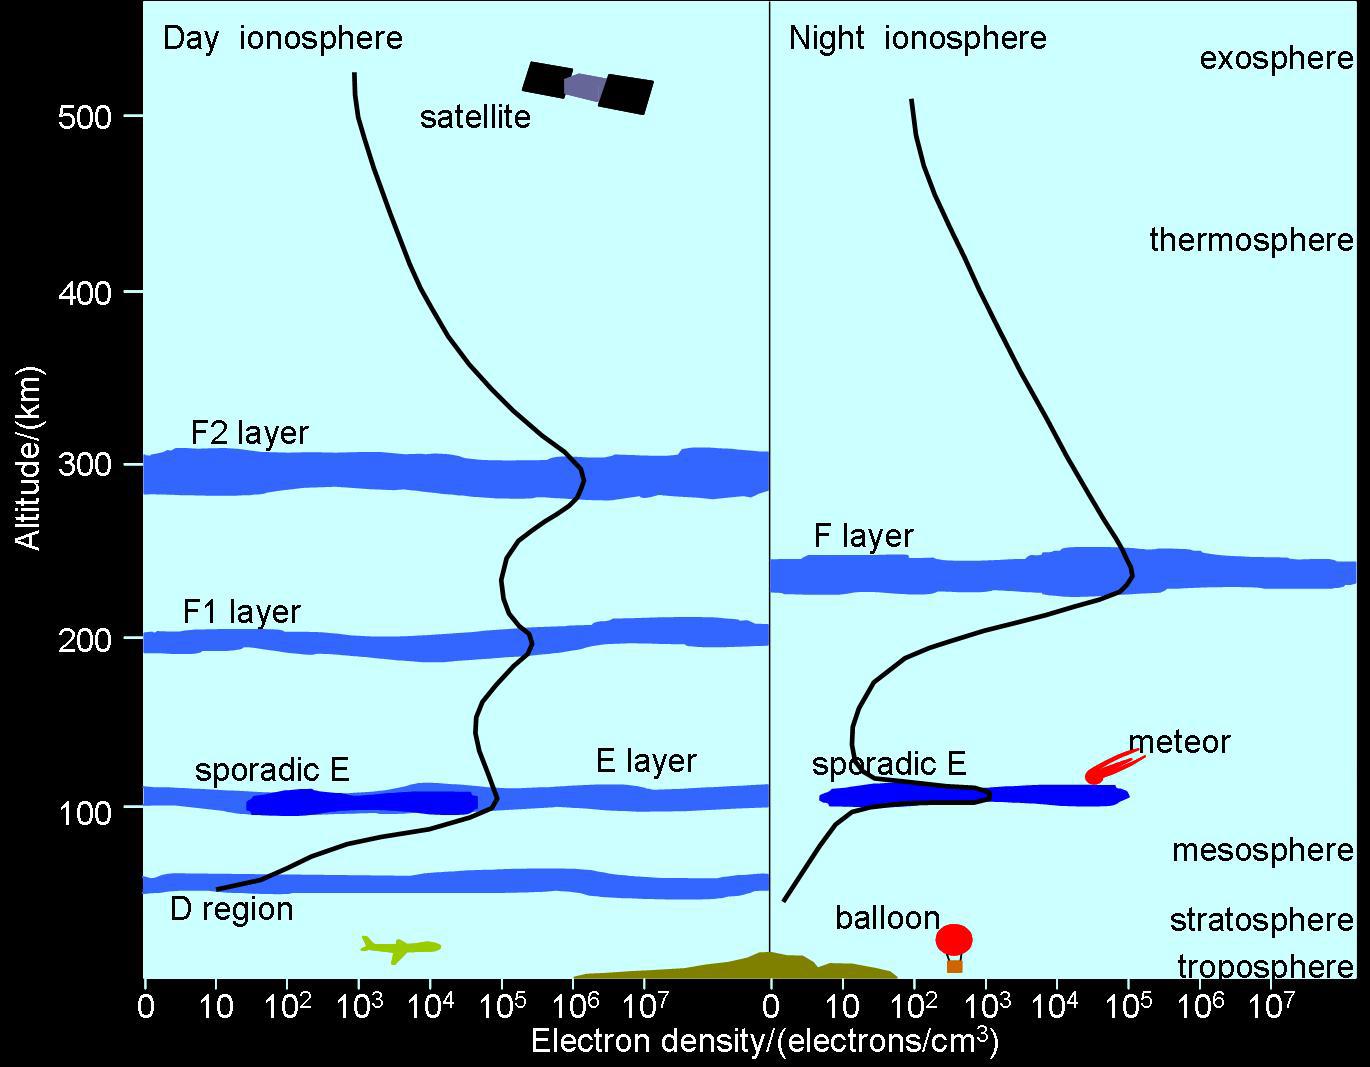
Figure One: HF waves are reflected by the ionosphere at a height of between 100 km and 500 km, depending on the radio frequency and electron density of the ionosphere.
The Solar Cycle and Sunspots
Space weather is driven by the Sun and follows the "solar cycle" closely. This cycle is typically about 11 years in duration and is manifest in many of the radiative and magnetic properties of the Sun. The solar cycle is defined in terms of "sunspots" on the solar disc. Sunspots are regions of extremely intense localised magnetic fields which appear darker than the surrounding surface. A sunspot region on the solar surface is akin to an extreme low pressure system or cyclone on Earth with intense magnetic fields rather than extreme winds.
At times, sunspots are rare and the solar disc appears almost without blemish. This occurs at solar minimum, the start of a solar cycle. Later, sunspots become common and it is normal to see numerous large sunspots, often assembled in complex groups, spread across the solar disc. The peak of the solar cycle, when sunspots are most numerous, is known as solar maximum.
There is a standardised way of counting sunspots present on the solar disc, to give the sunspot number or SSN, which is the traditional indicator of solar activity and the progress of the solar cycle.
Sunspots and the Ionosphere
The presence of sunspots is of particular importance to the HF communicator. Overlying and surrounding sunspots are particularly hot, bright areas called plage (after the French for "beach" and for the colour of sand). Plage regions produce Extreme Ultra-Violet radiation (EUV) in especially large quantities and it is EUV which causes ionisation of the all important F region.
At solar minimum, when there are no plage regions, there is less EUV and less ionisation of the F region. Consequently, the frequencies reflected by the F region are lower. At the peak of the solar cycle, solar maximum, ionisation is greatest and the frequencies reflected by the ionosphere are highest. Higher frequencies mean reduced attenuation by the D region and increased range.
Solar Flares and HF Fadeouts
Sunspots are also the site of solar flares which are huge explosive discharges on the surface of the Sun. Massive amounts of energy in the form of radiation and matter are bound by the intense magnetic fields of a sunspot region. During a flare, the magnetic field structure collapses, releasing the energy and matter into space.
X-rays released by flares bombard the Earth causing sudden and intense ionisation of the D region. This leads to increased D region attenuation of HF waves and in some cases total absorption of all HF frequencies for several hours. An "HF fadeout" or "Sudden Ionospheric Disturbance (SID) only affects HF circuits that have ionospheric reflection points in the sunlit hemisphere of the Earth (that pass through the D region). Night-side ionospheric reflection points are unaffected, being in the Earth's shadow and shielded from solar radiation.
Solar flares large enough to cause a total HF blackout, occur on about 300 days per 11 year cycle and are most common around solar mximum.
Further Ionospheric Disturbances and HF Communications
Often associated with large solar flares is the release of huge quantities of solar matter, referred to as a Coronal Mass Ejection (CME). A CME moves away from the Sun between about 400 to 1000 km/s, expanding as it does, so that it impacts the Earth usually within two to five days. The Earth's magnetic field is buffeted violently by the CME, initially as a shock and then as a period of large fluctuations to the geomagnetic field.
Coronal holes are another solar phenomena that also leads to geomagnetic disturbances on Earth. A coronal hole is like a window in the magnetic field structure of the Sun's corona that allows solar particles to flow more freely outward from the Sun towards the Earth.
CMEs are most likely to occur at solar maximum. Coronal holes are most common during the declining part of the solar cycle, from maximum to minimum, when the Sun's magnetic field is decreasing in strength.
Of concern to the HF radio communicator is that a significant geomagnetic disturbance or geomagnetic storm in the upper atmosphere initiates an ionospheric storm. When this occurs, usable HF frequencies are greatly reduced and irregularities in the ionosphere result in signals travelling by multiple paths (leading to signal fading).
Major geomagnetic and ionospheric storms can last for several days, causing severe disruption to HF communications. Associated with such storm periods are aurorae, one of the better known ionospheric phenomena.
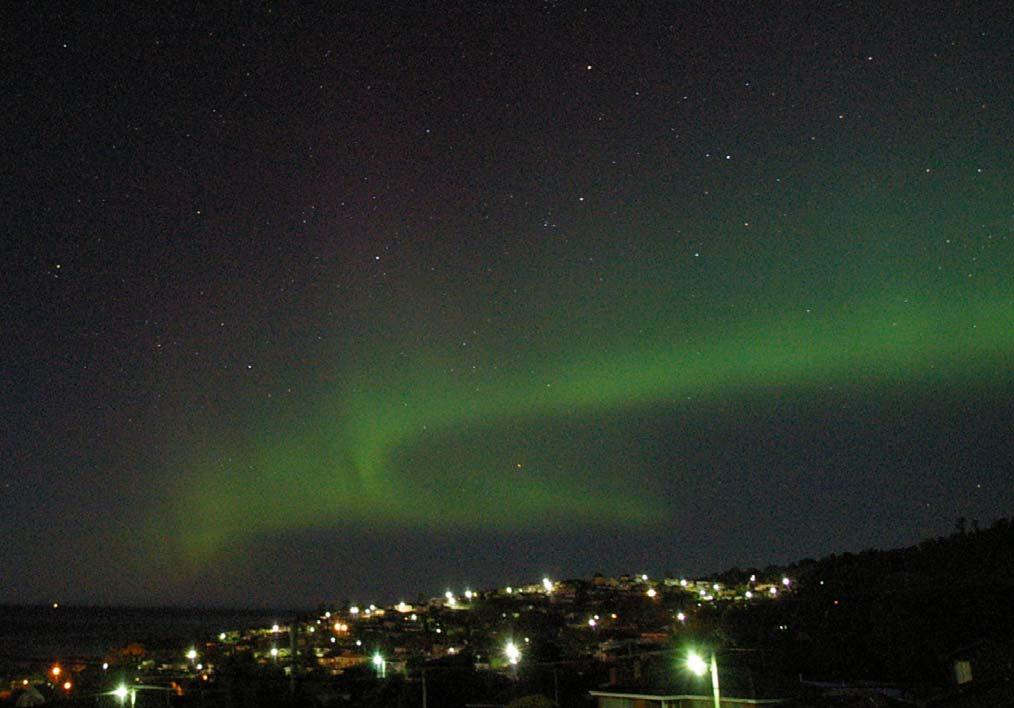
Figure Two: Aurora observed 25 August, 2005 in Southern Tasmania, Australia. Picture sent to Bureau of Meteorology - Space Weather Services by Dallas & Beth Stott, Blackmans Bay, Tasmania.
Ionospheric Prediction and HF frequency management
In the previous section of this article, HF radio communications via the ionosphere were discussed and the connection between the Sun and the ionosphere established. It was seen how the ionosphere is created by solar radiation and also how solar events can regularly disrupt radio communications which rely on the ionosphere.
One could be forgiven for thinking that with so many cataclysmic solar events going on and their effects on the ionosphere that HF is impractical. Fortunately, solar events that disrupt HF communications are not every day occurrences, happening on perhaps one hundred days per 11 year solar cycle. Events causing severe disruptions lasting for several hours that affect the entire HF spectrum are rarer still, occurring just a dozen or so times per cycle.
With constant observations of the Sun-Earth environment, disruptive solar events can be largely predicted and warnings and alerts issued in advance. The Australian Government agency responsible for monitoring space weather and issuing regular forecasts and warnings of imminent solar activity is the Bureau of Meterology's space weather branch, Bureau of Meteorology - Space Weather Services.
Predicting Solar Flares
The prediction of large solar flares has traditionally relied on observations of sunspot regions using ground based telescopes such as at the SWS Solar Observatory located at Culgoora, NSW. At present, ground based flare prediction is undergoing something of a revolution with new high resolution images of the magnetic field structures of sunspots becoming available. These new images, provided by the GONG project of which the SWS/USAF Learmonth Solar Observatory is a participant, provide new insights into the detailed magnetic behaviour of sunspots. Space weather agencies such as SWS along with solar researchers expect that by analysing the solar flares of the coming cycle with these new insights, we will be able to even better predict the size and timing of major flare events.
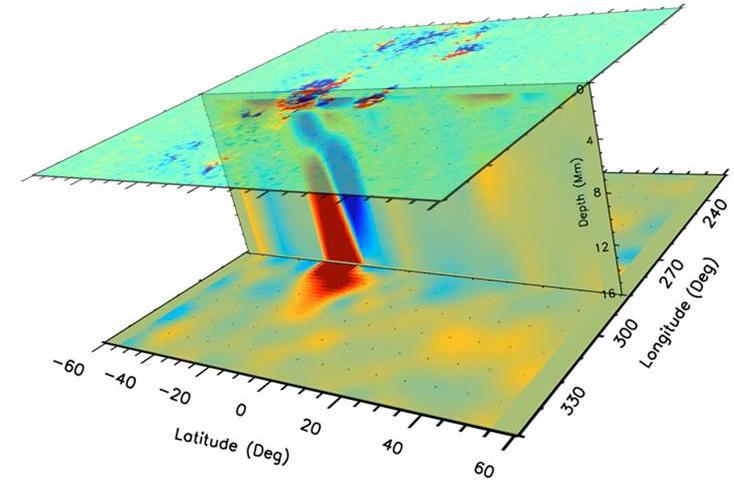
Figure Three: 3D image of plasma underlying two sunspots in close proximity showing tornado-like vorticity patterns with opposing senses. Such patterns are observed beneath every sunspot region which produces very large X-ray flares. Courtesy of the Global Oscillation Network Group (GONG).
Predicting Ionospheric Disturbances
The response of the ionosphere to a geomagnetic disturbance resulting from a CME or Coronal Hole (see Part One) is called an ionospheric storm. The effect on the ionosphere is complicated and depends on the time of day, the season and the latitude. However, severe geomagnetic storms invariably lead to severe ionospheric storms and depressed HF conditions.
During an ionospheric storm HF communication is likely to experience the greatest problems at higher latitudes (away from the equator). This is also where the well known ionospheric phenomena, the aurora, is to be seen during an ionospheric storm. The greater the disturbance, the more equator-ward HF communication problems (and aurora) are experienced.
SWS Solar observatories located in northwest NSW and WA monitor solar radio emissions to provide critical information such as the velocity of CMEs and the distribution of solar RF interference. SWS uses this information along with observations from ground based magnetic observing stations, NASA satellite based solar wind data and many years of experience to predict the location, intensity and duration of ionospheric storms. With continual advances in satellite based observations of the Sun-Earth environment, such as the NASA STEREO program and the growing body of ionospheric data and models, ionospheric predictions for radio communicators have been refined over the last 20 years.
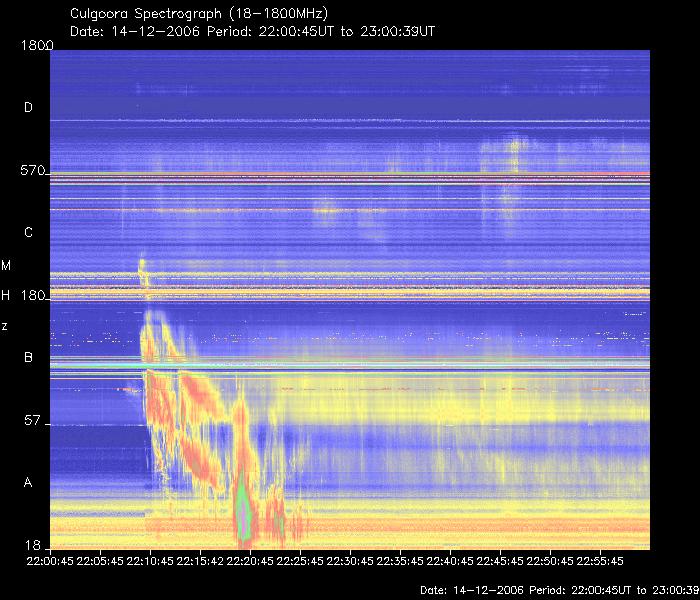
Figure Four: Radio emission burst highly characteristic of a CME moving through the solar atmosphere. The speed of the CME can be estimated from the slope of the radio burst. SWS Culgoora Solar Observatory, NSW.
Ionospheric monitoring and HF frequency management
Perhaps of greatest value, however, to the regular HF communicator is day-to-day frequency selection in response to the ever changing conditions in the ionosphere. While the solar cycle and solar events are very important in determining the frequencies supported by the ionosphere, equally large variations are observed with latitude, with the seasons and throughout the day and night.
SWS operates a large network and collects data from ionosondes located throughout the Australasian, Antarctica, and the Pacific which constantly "sound" the ionosphere. Ionosondes produce an "ionogram" showing the range of frequencies reflected vertically by the ionosphere and the altitude they are reflected from.
Using real-time and historical ionospheric data in conjunction with sophisticated HF propagation models SWS is able to provide detailed HF frequency guides for any communication circuit at any time of the day or night. Predictions of optimum usable frequencies are offered in real-time or predicted in advance and are freely available online.
One of the most popular SWS frequency guides is the HAP chart (Hourly Area Prediction), which gives the best HF frequency to use from any location into any area of the globe specified. HAP charts are available in real-time based on current observed conditions, or in advance with conditions predicted days, months or (with declining confidence) even years in advance, for any hour of the day.
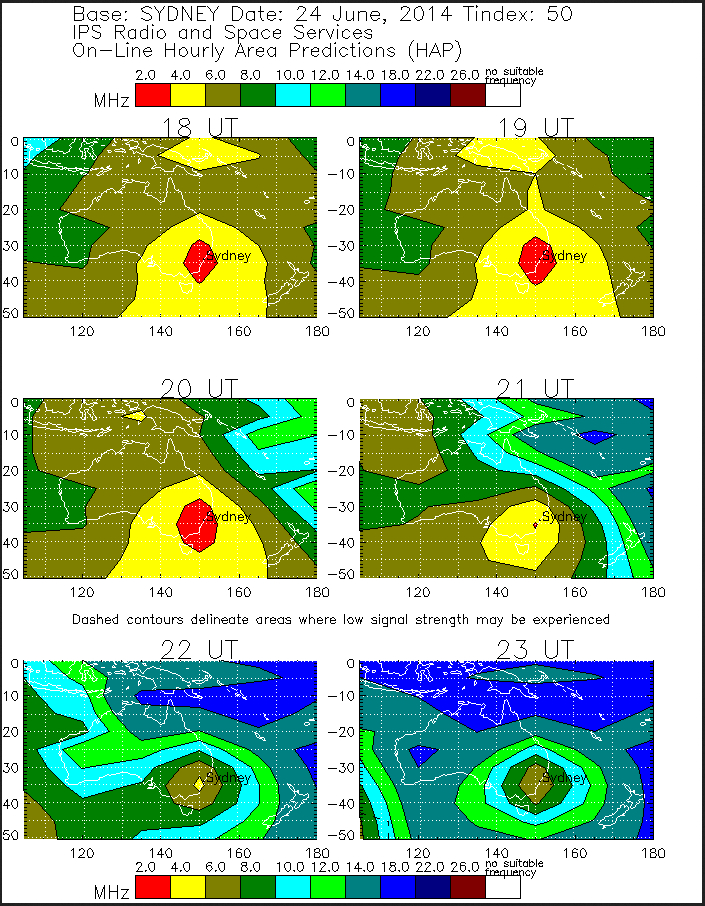
Figure Five: Daily HAP chart predictions showing optimum frequencies for HF communications between Sydney and anywhere in the Australasian region. For example, at 20 UT: for Sydney-Tasmania 4 MHz is recommended while for Sydney-Darwin, 6 MHz is recommended. Note the change in the ionosphere moving east to west 21 to 23 UT as the day-night terminator moves across the region.
Other SWS on-line products can provide a more detailed frequency guide once a circuit is specified. URSL predictions are simple to use, giving upper (U), recommended (R), secondary (S) and lowest (L) frequencies for a given circuit. GRAFEX predictions provide much more detail. Frequencies for different propagation modes via E and F layers and lower limits due to D region absorption are given, for every hour of the day; sufficient information for a knowledgeable HF operator to communicate reliably and confidently at any hour of the day.
The products mentioned above are available online through the SWS website. SWS has also developed two commercial software packages for HF communications engineers; ASAPS and GWPS. ASAPS (Advanced Stand Alone Prediction System) incorporates all the features of the HF predictions described above while allowing inclusion of specific transmitting and receiving antenna specifications for field strength and SNR calculations. GWPS (Ground Wave Prediction System) is for predictions of HF propagation via ground-wave only. It includes transmitting and receiving antenna specification and transmitter power and makes detailed predictions of range and receiver field strength for different levels of man-made noise.
Space weather effects on GPS and Satellite Communications
While GHz signals such as those used in GPS systems pass straight through the ionosphere, they suffer a time delay as a result of the presence of so many free electrons. This typically results in positional errors of 5 to 10 metres, which can increase to many tens of metres under extreme ionospheric conditions.
SWS produces detailed world maps of Total Electron Count (TEC) which are indicative of the expected time delay and are able to be used by satellite operators and GPS receivers to make positional corrections for the ionosphere.
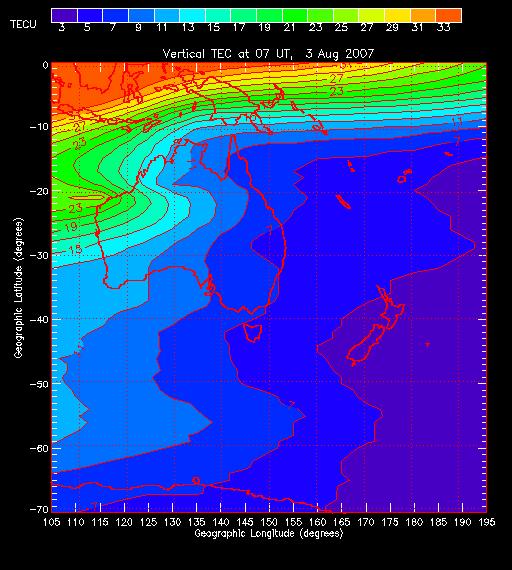
Figure Six: Australasian map of real-time Total Electron Count (TEC).
The Future of HF and Space-Weather Monitoring
With the development of digital HF mobiles able to provide email and internet connections, HF appears to be undergoing something of a resurgence. HF communication via the ionosphere is free and with proper frequency management, HF can provide reliable long distance communications 24 hours a day.
With the increasing dependence on satellite based navigation systems such as GPS, which are vulnerable to large solar and ionospheric disturbances, space weather alert systems will be increasingly important in the future.
Bureau of Meteorology - Space Weather Services continues to develop space weather and ionospheric forecasting and is committed to providing new services that meet the demands of the changing communications environment. SWS welcomes any enquiries about the Sun and its effects on the Earth and about the services we provide in support of HF communications and space weather.
Material prepared by Dr. Andrew McDonald
