


T Index Map
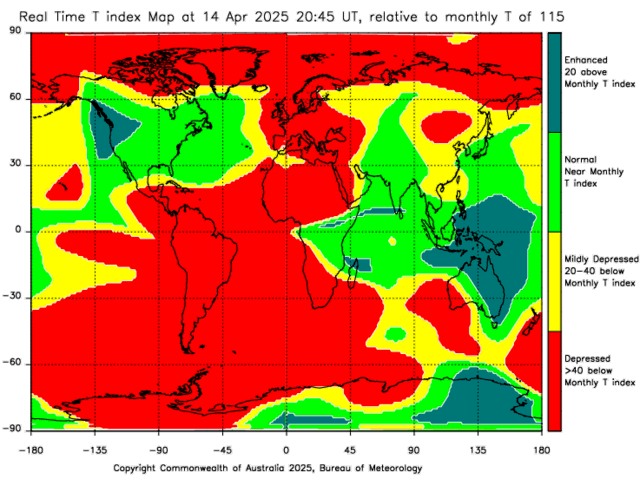
The below image shows a near real-time T index difference map. The differences are calculated by subtracting the predicted monthly T index for the global ionosphere from the observed T index. The observed T index is computed from the foF2 observations. More details on deriving T index from foF2 measurements can be found in T Index FAQ. The last 7 days of maps can be viewed using the control buttons underneath the image.
Map centre at longitude:
Updates: Every 15 minutes
Your browser has javascript disabled. With javascript enabled you would see control buttons here to enable viewing up the last 7 days of ionosperic maps images interactively.
The map shows four levels of T index difference contours. The depressed regions (yellow and red colours) can have weak to very poor high frequency communication support.
How to use this tool
- To animate, first select the display duration using drop-down list located below the graph and then press "Load Animation" button. The user can also choose different speeds of animations.
- To view still images during a playing, press "Pause" button and then use the navigation buttons located below the graph to switch between images.
