Solar Flares - What To Expect From This Solar Cycle
In August 1998 we experienced the most active month of the solar cycle so far (as of September 1998) in terms of the number of solar flares observed. There were a total of 18 energetic flares of which six were X class (the largest category) and 12 were M class flares.
How does this compare with other months during previous solar cycles? Perhaps such a comparison will put August into a true perspective and give us some idea of what we can expect as the solar cycle reaches its peak likely in the year 2000.
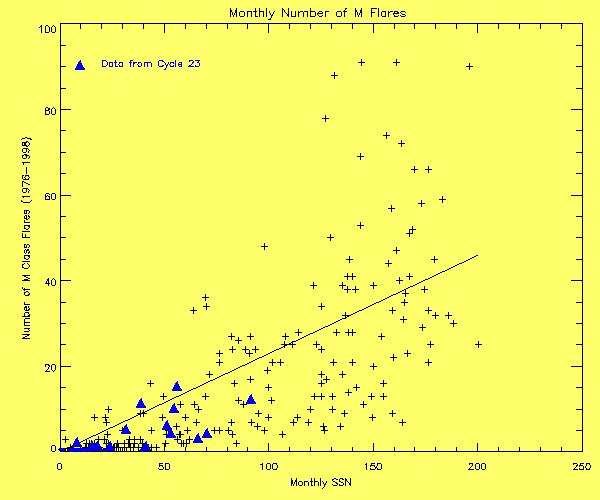
The graph below shows the number of M class flares for each month since 1976 plotted against the monthly sunspot number for the same month. The triangles indicate the data so far in this solar cycle (Cycle 23) and the plus signs indicate the months from earlier cycles (essentially Cycles 21 and 22). The solid line is the average number of flares observed for each month taking into account all of the data.
The graph shows that flare production so far this cycle has been quite modest compared with previous cycles. As we reach the peak of the new cycle we can expect months during which there are a great many more flares than in August. For example, the graph shows several months in which there were around 90 M class flares (and presumably quite a few X class ones as well). This means that there was an average of 3 M flares every day; and probably some days during those months were way above average!
So Cycle 23 is only now starting to kick into action. We can expect much more as the cycle progresses.

Material prepared by Richard Thompson.


