


Magnetometer Data: Data Examples
This document contains examples plots of magnetometer data typical for both low level geomagnetic activity (quiet days) and high level geomagnetic activity (storm days) for low-middle latitudes. Examples are also shown of spurious or anomalous data. All example plots are of magnetometer data recorded at Canberra (ACT) station with different trace colours for each of the geomagnetic components:
- red - north (h)
- yellow - east (d)
- green - vertical (z)
The horizontal axis is universal time (UT) and the vertical axis is magnetic field variation in nano- Tesla (nT) units. Figure 1 shows geomagnetic field variations ypically observed during "quiet days". The variations are dominated by effects resulting from "tidal" motion of the Earth's upper atmosphere due to the sun's gravitational field and are usually in the 10's on nT in amplitude.
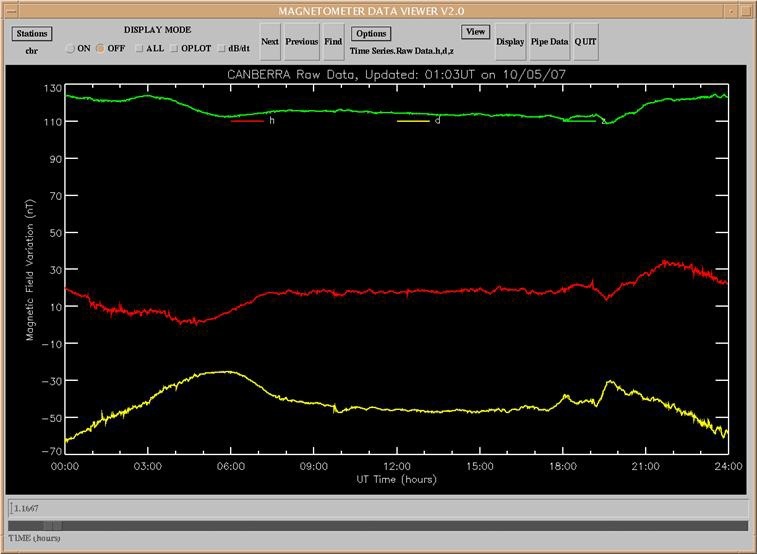
Figure 1: Plot showing typical geomagnetic field variations for three component magnetometer data recorded at Canberra, ACT, during a "quiet day".
Figure 2a and Figure 2b show geomagnetic field variations typically observed during "storm days". Geomagnetic storms result when events on the sun propagated through the solar wind impact the Earth producing current systems within the magnetosphere (cavity formed by the Earth's magnetic field) and ionosphere. Figure 2a shows the impact of an event in the solar wind manifested as a "sudden impulse" in the geomagnetic field at approximately 1415UT which is due to the compression of the Earth's magnetosphere under the increased solar wind pressure. This is particularly evident in the h-component trace for which a small interval around the time of impact has been magnified in Figure 3. Large variations in the geomagnetic field up to the order of 100's of nT can be seen in the hours following the initial impact and continuing into the next day (Figure 2b). These periods are referred to as the storm "main" and "recovery" phases and do not exhibit the predictable periodic variations of quiet days. Variations in the geomagnetic field slowly return towards those observed during quiet days once the Earth is no longer under the influence of the solar wind disturbance.

Figure 2a: Plot showing typical geomagnetic field variations for three component magnetometer data recorded at Canberra, ACT, during a "storm day".
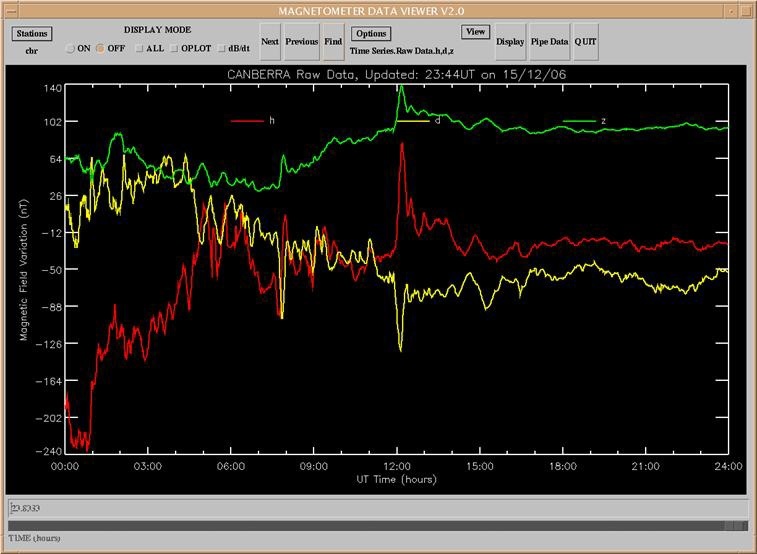
Figure 2b: Plot showing typical geomagnetic field variations for three component magnetometer data recorded at Canberra, ACT, during a "storm day".
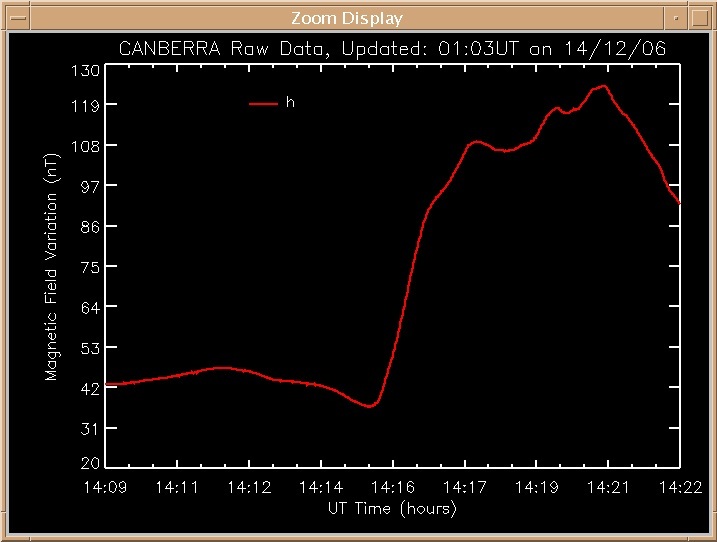
Figure 3: Plot showing geomagnetic field variation for a small interval of the h-component magnetometer data recorded at Canberra, ACT, resulting from the impact of a solar event on the Earth's magnetic field.
The majority of observed geomagnetic field data will exhibit daily variations in a range between typical quiet and storm days appropriate to the station latitude. On occasions, large variations in the geomagnetic field may be observed that are not the result of disturbances in the solar wind. One example of this is known as a Solar Flare Effect (SFE). Large variations may also result from "man-made noise" or equipment problems. The magnetometers used to measure variations in the Earth's magnetic field are highly sensitive to steel or structures containing Iron and hence the presence of cars or trucks for example will result in a "step" in the geomagnetic field data (Figure 4) if vehicles remain stationary, or "spikes" (Figure 5 and magnified plot in Figure 6) if the vehicles are in motion.
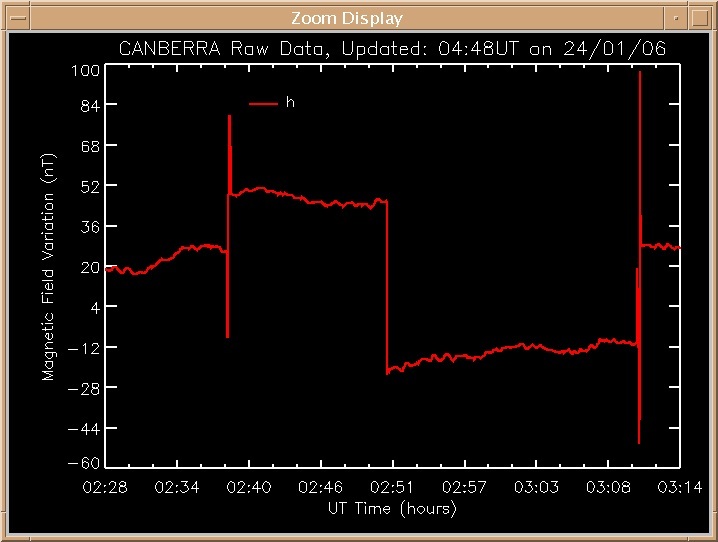
Figure 4: Plot of an interval of the h-component magnetometer data recorded at Canberra, ACT, showing "step" variations resulting from the presence of cars and trucks parked in the vicinity of the magnetometer enclosure.
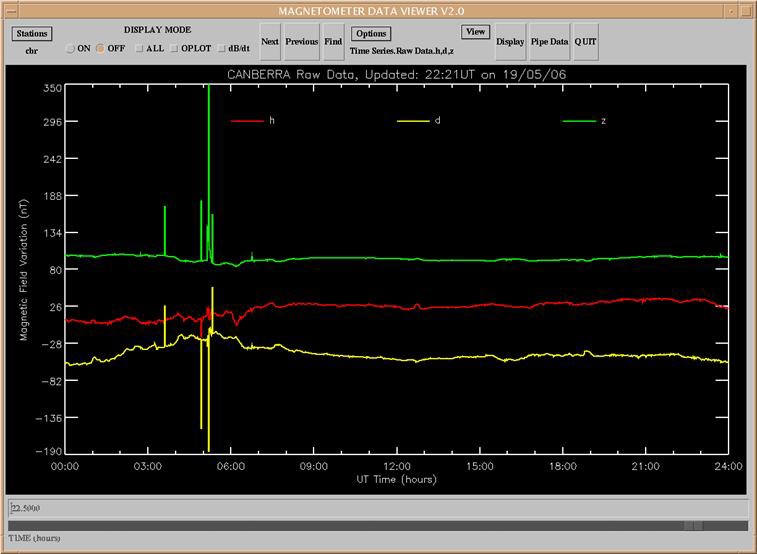
Figure 5: Plot of three component magnetometer data recorded at Canberra, ACT, showing "spike" variations typically resulting from vehicles passing in the vicinity of the magnetometer enclosure. A large vehicle passing nearby will typically result in the magnetometer output signal reaching full scale.
Figure 6: Plot of short interval of three component magnetometer data recorded at Canberra, ACT, showing magnified "spike" variations from Figure 5 typically resulting from vehicles passing in the vicinity of the magnetometer enclosure.
The geomagnetic field data should be used in conjunction with station logfiles as these may indicate possible contamination from man-made noise or other equipment problems.
