CASEY

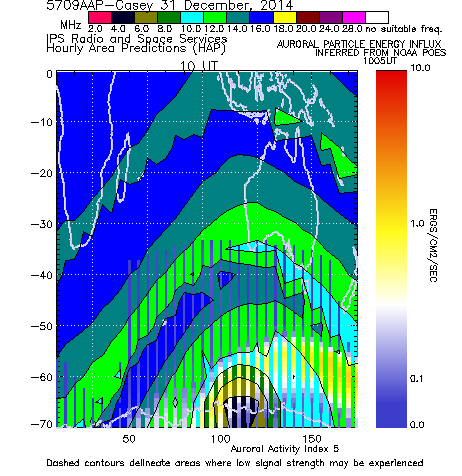
These HAP charts show appropriate frequencies for contact with a base station. The "bars" at the bottom of the image show the extent, position and intensity of the auroral oval. The plot of the auroral data has been broken into "bars" to allow the recommended frequency information to be remain viewable along with the auroral data.
An activity index of 7 or more may indicate that radio propagation may be degraded due to increased absorption from the disturbed ionosphere in the auroral region.
The auroral oval model was provided by Dr D. Evans and Dr S. Greer of the Space Weather Prediction Centre, in Boulder Colorado.


