IONOSPHERIC NETWORK ADVISORY GROUP (INAG)*
Ionosphere Station Information Bulletin No 5**
April 1970
Back to Bulletins index
1. INTRODUCTION
2. UNESCO TRIPS TO AFRICAN AND LATIN AMERICAN VERTICAL SOUNDINGS STATIONS
2.1 Overseas support of stations
2.2 Education and training
2.3 Local research and application of VI data
2.4 Antenna problems
3. COMMENTS ON SEMINAR ON HIGH LATITUDE IONOGRAMS, LENINGRAD. MAY 1970
3.1 G. A. M. King in letter.of Auaust 21. 1970
3.1.1 Dr. A. S. Besprozvannaya in a letter to W. R. Piggott of October 29. 1970
3.2 Prof. K. Rawer, President. URSI Commission 3. in letter of September 15. 1970
3.3 Dr. A. S. Besprozvannaya in letter of August 19. 1970
3.3.1 W. R. Piggott reply to Dr. Besprozvannava
4. NOTES FROM INAG MEMBERS
4.1 Report on a Conference of Australian Ionospheric Station Operators |
5. SPECIAL REPORTS
5.1 Topside Sounding
5.2 Comments on Need for Visits
6. REPORTS FROM STATIONS
6.1 Canadian Network
6.2 Bangkok. Thailand
7. NOTES FROM WDCS
7.1 World Data Center A - Upper Atmosphere Geophysics. NOAA. Boulder. Colorado. U.S.A. 80302
7.2 World Data Center B2 on Solar-Terrestrial Physics, IZMIRAN. P/o Akademgorodok, Moscow Region, USSR
7.3 World Data Center C1, Radio and Space Research Station, Ditton Park, Slough, Bucks. England
8. MISCELLANEOUS ITEMS
8.1 HANDBOOK OF IONOGRAM INTERPRETATION AND REDUCTION SECOND EDITION
8.2 Translation of INAG Bulletins into Russian
8.3 Ionospheric Storm Project
8.4 Report for Period March 6-l0, 1970 |
This issue of the INAG Bulletin has been delayed due to the Chairman's visit to Vertical Incidence Soundings Stations in South America, The general increase in interest in this type of measure-ment results in more correspondence and increased efforts to make the network efficient. This causes some overloading of your officers. We can only apologize for the resultant delays.
We have much pleasure in welcoming Dr. A. S. Besprozvannaya of the Arctic and Antarctic Research Institute as a member of the Ionospheric Network Advisory Group. Dr. Besprozvannaya has a very wide experience in morphological studies and in the interpretation of ionograms and has made detailed stud-ies of ionograms from many countries. She has written a very large number of papers, many of which are only available in Russian. We feel sure that her energy and enthusiasm will be a great help to INAG and to the stations which it serves.
Some of the correspondence generated by the publication of the discussions at the Seminar on high Latitude Ionograms, Leningrad May 1970 is reproduced in this issue so as to start world-wide discussions, INAG wishes to stress that, while High Latitude problems are critical at high latitude stations, similar phenomena are often seen at lower latitudes. Thus the sequences on ionograms found when a high latitude trough and ridges move over a station are closely paralleled in some temperate latitude zones when the sunrise trough crosses a station or when the equatorial anomaly is develop-ing at low latitudes. The tilts of the surfaces of constant ionization can be equally large, 30�- 60�, in these cases. The main difference is the number of hours at which such phenomena are found. This varies considerably with latitude and longitude. The same principles of analysis can be used in all regions and it is worthwhile to stress the similarity in interpretation.
In our first Bulletin we summarized the Proceedings of the Special Meeting on problems of VI Ionospheric Soundings Network, London 1969, which were endorsed by the URSI/STP Committee and URSI General 'Assembly (Ottawa 1969). In addition to setting up the INAG organization, this meeting recom-mended that selected experts be sent to visit the stations, with special stress on visits to stations in South America and Africa.
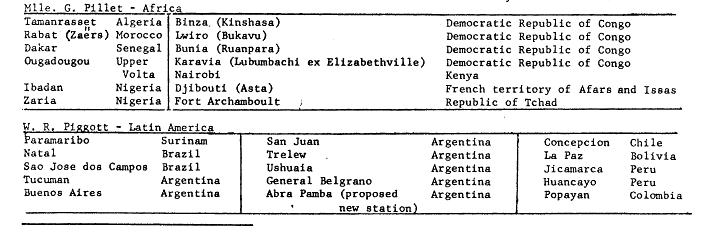
As a result of these recommendations and parallel suggestions by CCIR (Opinion 22-1, 1970), UNESCO financed and organized visits by Mlle. G. Pillet to the African stations (January 5 - February 15, 1970) and Mr. W. R. Piggott to South America (October 1 - November 5, 1970). A full report on these visits must await the publication of the official reports by UNESCO. However, some notes on problems which appear to be common to many stations are given below.
Stations which were visited or with which contact was made indirectly are as follows:
While examining random samples of ionograms for discussions on ionogram analysis at stations in South America, your Chairman was surprised to see fairly typical sequences of auroral type sporadic E even in the tropics. These have not been recognized or reported despite their importance for the study of particle activity at low and temperate latitudes. We would like to appeal to all operators to read the appropriate sections of the URSI Handbook of Ionogram Interpretation and Reduction, the Annals of the ICY Vol. III part I and the Atlas of Ionograms and to make a special effort to identify cases of auroral Es, retardation Es and night E at stations distant from the auroral zones, If you have doubts about the interpretation, please send sample sequences of ionograms to your nearest INAG member or to the Chairman or Secretary of INAG. As it is clear that the circulation of our earlier Bulletins has not been as complete as we would wish, the addresses are reproduced on the last page of this bulletin.
INAG would like to draw attention to the difficulties of vertical incidence groups in developing countries due to lack of contact with the literature. Some of the groups, including some attached to Universities, do not have access to standard journals such as Journal of Geophysical Research, Jour-nal of Atmospheric and Terrestrial Physics, Journal of Planetary and Space Science and others are restricted to these journals plus, sometimes, Annales de Geophysique. We appeal for copies of re-prints of interest to small research groups which we could circulate according to the main interests of the deprived groups.
This issue also contains a report on a Conference of Australian Ionospheric Station Operators. The experience of your visiting experts underlines the importance of arranging similar regional conferences in other regions.
W. R. Piggott
Chairman, INAG and URSI/STP VI Consultant
Return to the CONTENTS
By W. R. Piggott
Pending the publication of the UNESCO reports on these visits, which we hope to circulate to all stations and administrations, it seems worthwhile to start discussions on a few general points.
The operation and existence of a number of stations depends on the generosity of other countries in supplying film, spares and in some cases technical training or assistance. Most of these mutual aid schemes are relics of the history of the development of the subject and do not necessarily match current mutual interests. This situation is unstable and the future of stations dependent on it is hazardous. Although the use of the data obtained is growing, the organizations using it tend to have little contact with stations and their' problems and no specialized facilities to help. Your views on what should be done would be most useful.
A central problem in obtaining good data is the proper training of operators and analysis staff. In many countries this is seriously hampered by language problems -- most of the standard references are written only in English and the trainees lack sufficient English to be able to read the literature with adequate understanding. Even for English speaking people it is difficult to learn the procedures adequately without proper teaching. Each class of ionosonde has its particular faults and difficulties and each part of the world shows its peculiar types of ionograms. Thus the training center must have examples appro-priate to the trainees station. Many of the analysis staff met during these visits were capable of being trained to high standards but lacked the necessary teachers. This prob-lem was widely discussed, the most promising proposal being to set up regional training schemes using the best available local talent to be extended in the future by advanced classes from an expert in the field. The general view in South America was that the staff could be trained to give scientifically useful data if the problem was considered systematically and the needed action taken.
The work needed to translate even the Handbook into French, Russian and Spanish is very considerable and is probably not possible unless several volunteers could be found who were willing to collaborate for the general good. Your views, and if possible collaboration, are invited. A new edition of the Handbook is likely to be available in the next few months, so the need is urgent.
There is a widespread belief that most worthwhile research using ionograms has already been done in the advanced countries, in particular in Australia, France, Germany, Scandinavia, UK, USA or USSR and that there is little left to be done at individual stations. This is easily demonstrated to be untrue, many phenomena which are common features of the behaviour of particular stations have not even been described in the literature! In addition there are considerable possibilities for regional studies both of the ionosphere itself and its relations with airglow, magnetic changes and meteorology. In conjunction with space agencies, there are many possible investigations linking local and space data. Particularly in the poorer countries there are considerable economic advantages in exploiting H.F. communications which can only be fully utilized by local studies of the ionosphere and iono-spheric propagation. With proper foresight and judgment of the rate of economic advance it should be be possible to combine the research with training of the people needed for the practical use of H.F. On the whole the trend appears to be away from long distance point-to-point circuits and towards much larger numbers of relatively short range low loaded links, though some groups feel that long range H.F. point-to-point, where the ionosphere is relatively stable, has economic and user advantages over the competing satellite technique. Where such developments are likely to occur the importance of local studies of the local ionosphere must be stressed. The type of work which is most likely to be effective depends on the type of people available, the economic position of the country, the type of training needed for local development as well as scientific value. Geophysics has the advantage that phenomena vary with position and time so that useful projects can usually be found to fit a wide range of logistic difficulties.
Many groups visited requested information on antennas. As it is often cheaper and more convenient to improve antennas than to make major overhauls and improvements to ionosondes, there is a growing interest in improving antennas. The following notes may help and stimu-late further discussions of this problem.
- Note that the problem of the most efficient transmitting antenna is different to that of the most effective receiving antenna.
- In the transmitting case the object is to radiate as much power as possible verti-cally. This implies:
- that the antenna can be coupled efficiently to the transmitter
that the polar diagram has a maximum in the vertical direction over as much as possible of the desired band of frequencies
- t the radiation resistance of the antenna is sufficient for effective radiation.
In general it is not possible to meet these requirements efficiently over the whole band of frequencies transmitted using a single antenna and marked improvements are possible using several antennas suitably designed. This involves a make-before-break antenna switch preferably operated from an adjustable relay, so that the changeover frequency can be adjust-ed by trial and error to suit the responses of the chosen antennas.
The following systems are widely used:
- Log aperiodic. A well designed log aperiodic antenna gives excellent ionograms at frequencies above about 3 14Hz but must be supplemented by a lower frequency anten-na. It is relatively expensive and difficult to build and set up.
- Deltas and rhombics. Deltas and rhombics are cheap to construct and erect. For a given height of mast and total span, a delta is more efficient than a rhombic on the lower frequencies but its main lobe splits at a lower frequency than the rhom-bic, restricting the efficiency at higher frequencies. A good compromise is a large delta with a rhombic mounted inside it, the former radiating on frequencies up to 5-7 14Hz, the latter at higher frequencies. It is somewhat laborious to work out the dimensions of the optimum shape of antenna which can be mounted on a mast of given height, h, for use over a given frequency range using conventional methods (see, for example, R. Bailey, Wireless Eng, 28, 208-214, 1951).
The work can be greatly simplified using a technique, originally developed by Piggott, in which the length of one of the sides of the antenna is expressed as nh where n is the design parameter. The solutions are given by:
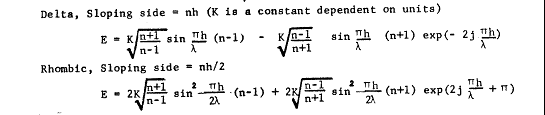
The first maximum for each term occurs when the sine function is unity, the first term mainly determines the highest frequency on which the antenna can be used, the second the lowest frequency. Interference due to two terms usually causes oscillations of amplitude 3-6 dB which are not important. The same technique can be ap-plied to other types of aperiodic antenna (see Bailey loc.cit.).
The full solutions can be used if preferred though it is seldom worthwhile to consider the radiation from the bottom wire of a delta and its reflection on the ground. Minor changes in shape can be made to make the ground reflected wave add to the upgoing wave at frequencies near the first minimum of the polar diagram, thus slightly increasing the maximum frequency usable with a given design.
- Tuned folded dipole for low frequencies The ESSA design is very effective but the relays needed to shorten the antenna as the frequency increases often give excessive troubles. A less efficient but more reliable antenna can be made by terminating the folded dipole with a resistor of about 700 ohms capable of dissipating the output power of the transmitter. The antenna should be as long as practical, kinks due to masts not being in a straight line have relatively little effect on the radiated power.
- A number of other terminated antennas have been used successfully, e.g. trapezium or bent folded dipoles descriptions of which will be found in the literature.
- Receiving antennas. In the case of receiving antennas the requirements are:
- Sufficient pick up of signal to override signals or noise picked up in the receiver or earth system.
- Optimum signal-to-noise ratio.
It is usually a disadvantage for the antenna to deliver large signals to the receiver. Particularly with ionosondes in which the HF circuits are not tuned, such signals can cause overloading and cross modulation, greatly increasing the apparent noise and interference levels, and a better overall signal-to-noise ratio can be obtained by inserting an attenuator between the receiving antenna and re-ceiver. This gain is particularly noticeable at night when many strong interfer-ing signals are present.
In many parts of the world most of the unwanted signals and noise are verti-calling polarized and a simple horizontal antenna can show significant gain in signal noise ratio. Terminated (aperiodic) antennas usually show less stray coup-ling to such signals than resonant antennas.
Return to the CONTENTS
The main objectives of the seminar were to consider difficulties in high latitude interpre-tation and the use of high latitude ionograms for scientific purposes.
The data abstracted from the ionograms during routine interpretation are used for practical propagation work and also as background material for research. For the first, the rules have recent-ly been changed by the addition of fxI. This recognizes that an obliquely propagating radio wave can be reflected by the most dense region in the neighbourhood of the path mid-point and is not necessari-ly limited by the instantaneous density at the midpoint itself. This particular rule has the virtue of simplicity - an operator does not need to strain his judgment.
- When the data are required also for scientific research we demand more of the observer, and in lots of cases his judgment is not equal to it. If the operator is at the station for a long time, presumably the training can be more thorough. However, three of our stations are manned by the year, and we are not even the employing authority so that the training period is limited. We like to get the observer for at least six weeks, but. this year the observer for Campbell Island has only 3 1/2 weeks with us, and besides interpretation he must learn the equipment! Communication with him during the year is only by radio. We can't blame this man if his interpretation is a bit sloppy. In fact, we ask him to read just 4 parameters so that we get them right.
You may feel that our staffing problems are extreme. However, we have had many instances where the staff have been well trained, where their interpretations are adequate to routine needs, yet the readings of the more complicated parameters are not good enough for research. For example, Miss Bullen had the Campbell Island and Cape Hallett E layers re-read under her careful supervision for a paper on "Enhanced Activity in the Ionospheric E-region" (J.A.T.P. ~ 879, 1966). She also had the Ellsworth 1957 and 1958 F regions re-read for studies on layer replacements, the new interpretations being often very different from the original. As a third example, she plotted the types and occurrences of Es at Hallett and Scott for many years and concluded that, even with good training (and she was responsible for it), the observers showed too many idiosyncrasies for reliable statistics.
Those of us with sufficient physical background can look at difficult ionograms and agree on the nature of the ionosphere and on what to write down on the data sheets, but we can't expect the ordinary observer always to be as well versed, This is the first point I wish to make.
- The second point is my amazement that the scaling rules need to be rewritten for times when the ionosphere is tilted. In April, 1946, J. Meek and F. T. Davies issued an "Observers Instruction Book for Canadian Ionospheric Stations". Their figure 3 illustrates F-region problems at high latitudes. 3a and 3d show that oblique traces with high foF2 do not generally extend down to frequencies below a crossing of the lower density "overhead" while "obliques" with low foF2 are complete - good observing and interpretation in those days, but surely now commonplace. Perhaps the proposal from the seminar intends that the rules be supplemented by examples with discussions of the geometry. This is a good idea. Those with low latitude stations are just as conscious of the need to consider tilts and departures from the simple "layer".
- My third point concerns spread-F. Once again, this is a matter of geometry. There does not have to be a lot of structure in the ionosphere to cause a messy-looking ionogram -people tend to under-estimate the complexities of geometry. Moreover, simple changes in the position of the sounding station relative to structure can cause apparently large chang-es in the ionogram. For example, oblique, spread traces can appear, disappear and then re-appear with only a uniform horizontal motion of a structured layer.
Such accidents of geometry are relevant to the usefulness of methods for classifying spread-F, whether by Penndorf's method or into range and frequency spreading. I adopted the latter for my paper on spread-F (JATP 32, 209, 1970). I pointed out that "as range spreading de-cays it is replaced by frequency spreading". It follows that one expects to find both pres-ent under most circumstances, their relative importance being determined, not only by the state of development of layer structure, but also by the geometrical accidents. While the classification is useful for special studies it is of little use if made routinely and is burdensome to an operator. Similar remarks apply to Penndorf's method. While I appreciate that the use of a classification by station networks would be optional we do feel some obligation to conform, Those who advocate a routine classification should be quite realistic about its usefulness, remembering the small amount of real physics that has come from the sporadic-E classification.
- The seminar has given much attention to high latitude troughs and the structure of the polar cap F-region. Indeed these are important subjects, but subjects for particular and detail-ed study. They are not suitable subjects for statistical analyses relying on operator judg-ment. In my own detailed studies my judgment has been strained so I cannot yet see how to present the material convincingly in journal articles. I oppose the introduction of h'I on the grounds that in each particular case its meaning depends on local geometry of which we have no other knowledge. The ratio, h'I/h'F, does give the secant of the zenith angle to oblique structure.
- Point five concerns night-E and type r Es. It is distressing to read in the proceedings of the seminar that "Most participants had experience in use of fbEs for Es type r and held strongly that the rule should be altered for this type so that a numerical value was ob-tained", and proposals to alter rules in a way that can only confuse us further. The In-struction Manual for the IGY (Annals of the IGY Vol. IIIa) defines type r as "non-blanketting Es with group retardation at the high frequency end. Group retardation showing on the Es trace but not on the F trace at the corresponding frequencies" (Annals, p. 94). The URSI Handbook of Ionogram Interpretation and Reduction (Handbook, p. 59) defines type r as "An Es trace showing an increase in virtual height at the high frequency end similar to group retardation but which is non-blanketting over part or all of its frequency range.
This is distinguished from the usual group retardation (as in the case of an occulting thick E layer) by the lack of group retardation in the F layer traces at corresponding frequencies and the lack of complete blanketting". Note that the Handbook allows a little blanketting. The Seminar now proposes that "The trace of this type displays group retard-ation at its high frequency end, which is not always present at the low frequency end of the F region trace. This type can be either transparent, or partially or fully blanketting." By this definition an operator could put all E traces with group retardation (if not normal E) into the type r class. There would be no need for the phenomenon of "night-E".
Now this Observatory has done a lot of work on night-E, reported in some ten scientific papers. An essential factor has been the ability to distinguish between overhead and oblique thick E layers - between layers which blanket and those which do not. To do this with the routine data in a way which does not confuse the observer we have been careful to maintain the definitions of night-E and type r Es exactly as given in the Annals (Definitions on pp. 106 and 94). The Handbook's definition of type r tends to be confusing while it does not formally define night-E. Through the unfortunate circumstance that different people corn-piled text and illustrations, the four examples of type r given in the Annals do not conform to its definition. The Handbook has carried on the error by referring to these examples.
Turning now to the question of where to tabulate type r and night-E: Both the Annals and the Handbook say that night-E should go with normal E. This decision was made originally on the basis of Canadian experience that night-H can occur in the daytime and over the periods of sunrise and sunset, often being only marginally distinguishable from normal E. In the New Zealand longitudes we find the same. In the Siberian and South American longitudes, of course, it is almost completely a night-time phenomenon. For a strong case against changing the present practice I recommend Miss Bullen's paper mentioned earlier (J.A.T.P. 28, 879, 1966).
- I am aware that the tone of these comments on the Seminar is strongly negative. It can be summarized as, "Don't change the rules unless the case for a change is overwhelming." In their enthusiasm, the participants have on occasion overlooked this guiding principle. They also hope that the routine observer will share their enthusiasm, their experience and their judgment, and I'm afraid that they could be disappointed.
Thank you very much for Dr. King's comments you so kindly sent me. I would like to answer Dr. King's comments on Leningrad Seminar recommendations. If I have understood Dr. King correctly, his main argument states that however elaborate the data reduction might be, the quality of the data would finally be defined by the training of an operator which is always lower than the knowledge of the researcher. That is why we can hardly hope to get adequate ionospheric data for research.
In fact the personnel problem is a very serious one in every country, but nevertheless we should seek means of obtaining reliable information from the ionograms, suitable for a researcher who cannot obtain the original data. Obviously with the increase of scientific contacts this problem becomes extremely urgent, since the scientists now are getting more possibilities to carry out planet-. ary studies of the morphology of the ionosphere. And the use of identical methods of data interpre-tation together with identical data presentation becomes critical. Therefore the main objective of the Seminar was to discuss the Manual recommendations and to what degree they provide for the uniform-ity in the data reduction practice.
- Data analysis has shown that even with similar physical background the information obtained from the ionograms considerably differs, this mostly applies to the following parameters:
- determination of electron density in F2 layer.
- determination of electron density and classification of Es traces.
It is these two problems that were mainly discussed at the Seminar.
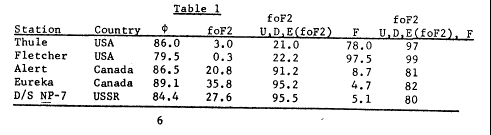
- Table 1 shows the information obtained from the tabular data on foF2 parameter for December
1958 from 5 high-latitude stations. These stations belong to different countries, but their physical conditions are similar: they are all situated in the area of the polar cap, latitude greater than 80�.
The table presents the number of cases in per cent of hourly values for the month when the numerical value of foF2 was scaled as an accurate average or scaled with descriptive letter F and qualifying letters D,E,U because of the spread (F), or the number of cases when in-stead of a numerical value the letter F appears in the Table. This Table shows that different reduction techniques do exist. The recommendations given in the Handbook, hence, are insufficient to provide identical reduction of the foF2 parameter when oblique and diffuse traces occur.
As it is known the definition of foF2 implies two stages: selection of the main trace and scaling of a numerical value on the basis of accuracy limitations. That is why the Seminar recommendations (paragraphs A and 14) state the necessity of reconsideration of scaling rules and accuracy limits in the presence of oblique and spread reflections in order to get iden-tical data.
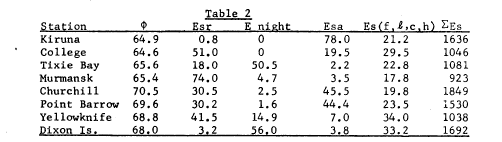
- Table 2 gives data on Es trace division into types for a number of stations, which are also situated in similar physical conditions (auroral zone). The data are presented in per cent of the number of Es traces as shown in the last column of the Table.
It is evident from the Table that discrepancies mostly occur when classification of Es either by r, a or E night is being made.
The Seminar suggested to revise recommendations of the Manual concerning Es and H night and definition of Esa type.
Reddy and Matsushita convincingly showed in their works the role of the fbEs parameter as an indicator of electron density in the lower ionosphere. The clear physical meaning of this characteristic makes it necessary to reconsider rules of fbEs reduction in order to get the maximum numerical valueof this parameter.
- Concerning Dr. King's comments on the classification of diffuse traces by range and frequency spread, I would like to notice that Seminar's agenda included it in order to define whether it is necessary and practically possible for an operator to differentiate these types of spreading for our future research. I am very sorry that Dr. King was unable to come to the Seminar for I hope that a more detailed acquaintance with the reports made at the Seminar and discussions which followed might have convinced him in the necessity to recon-sider the Manual and to add some new recommendations.
Return to the CONTENTS
In the Leningrad report, I disagree strongly with the proposals that the types h, c and f should be combined. The distinction between h and c has been quite helpful as it is a classification according to the height of the normal E-layer. Even this is not an absolute height scale, it is a physically well defined level. I am not against the proposal to take out type 1, and it may even be that I misunderstand your text, in case you were feeling that types h, c and f should only be combined at the statistical treatment.
At this occasion I like to propose for discussion the use of type q which should be strictly limited to the equatorial zone. If we stick to the purely descriptive view, it might sometimes happen that people use q for a high latitude record, and that is certainly not the intention. I have no information whether this happens sometimes, but it should be made clear that q is only equatorial and that a and r are only to be used in the presence of high latitude forms of Es, so that the appearance of these symbols at temperate latitudes should always indicate disturbed conditions.
The presence of two structures in the F-region is mentioned. This happens pretty often also at temperate, particularly at low latitude during sunrise, and there are some publications about it. Thus we have to think about the statement of the Handbook covering all latitudes.
As to the formulated proposals of the Leningrad Seminar, I am not very happy with point (c) under D. Just for the reason in making something voluntary, we certainly provoke different applica-tions at different stations.
Seen as whole, I am quite happy with the outcome of the Leningrad Seminar, and I agree with you that we should issue a high latitude Supplement to the Handbook after the main book.
Minnis proposes that changes in the reduction rules for high or for all latitudes which might be proposed in this context, should also be accepted by Commission III. I agree with this proposal, but I would like to have also the chairman or the secretary of the URSI-STP Committee in the circuit, particularly as INAG reports to this Committee and not to Commission III, On the other side, I suppose that everybody involved agrees that the members of Comm. III should be informed about major changes before they are introduced.
Return to the CONTENTS
I gratefully acknowledge the receipt of "Draft Copy of the Report on the Seminar on High Latitude Ionograms, May 1970" and information on this seminar in the INAG Bulletin. There are no comments nor additions that I would like to make, as the documents are written clearly and distinctly.
However, I would like to draw your attention to a concrete proposal, which can be considered as a continuation of our joint work on the analysis of the vertical sounding data which was success-fully started by the Leningrad Seminar. The essence of our proposal implies the following:
It was decided in March 1969 in Kiruna by the initiative of ESRO to organize inter-national co-operation on the analysis of geophysical phenomena, associated with substorms in the magnetosphere, and I think that it would be highly desirable to organize a similar International Program for the data of vertical sounding, in particular to study such para-meters as fbEs, fCES, types Es, foF2, fxI and F2 spread type in order to observe their plan-etary distribution in periods of different magnetic activity. The periods should be chosen considering their maximum coverage by the satellite data on the particle fluxes, electron density in the outer ionosphere as well as the data from magnetosphere.
The analysis of such maps might allow us to:
- evaluate and clearly see the degree of identicalness in the data reduction, since the maps would show the data of nearby stations or stations situated at the same geomagnetic latitude, but belonging to different countries with different reduc-tion techniques;
- to evaluate the representativeness of the network c-f ionospheric stations, data of which are used for the preparation of parameter distribution maps;
- to reveal the validity of the ionospheric data for indirect determination of cer-tain characteristics of the near-Earth space, (the limits of closed and open force lines, plasmapause position, particle spectra, etc.).
The data of vertical soundings should be collected in one center, preferably in the center which possesses maximum possible satellite data. In choosing the periods it should be remembered that high latitude ionospheric data are received by the scientific centers with a 6-month delay.
I would greatly appreciate your comments on this proposal. I would be very interested to know the opinion of the concerned geophysical community.
My own feeling is that an exercise such as you suggest would be worthwhile provided someone such as yourself was willing to organize it. I feel that it is important that the data are used and are seen to be used so that we need the names of those willing to work on them. This is more impor-tant than collecting at the best centre - too many collections are not used. It is also important that the results are published within a reasonable time of the study. This could be done in the normal literature or using W.D.C.A's Geophysical Report system (UAG series).
We do not believe that Es types "f" and "??" can be separated. It would take special experi-ments with properly designed ionosondes to establish the height of normal H reflections at night. One type should be used rather than trying to separate "f" and "??".
The problems with r-type Es are whether it is blanketing; and when it apparently is, is it-complete blanketing? If r-type is present with no F region, it would be interesting to observe whether the F region is present at a lower frequency on a matching topside ionogram. This would take a project to determine if suitable topside ionograms were available.
Is it important to decide when r-type Es (and/or enhanced E) is present whether it is blan-keting or non-blanketing? Or is the most important question whether the layer can support communications?
It is difficult to expect field station personnel at remote sites to be able to reduce these more tenuous points properly. This is especially true for the difference between E and Es.
In scaling ?-type Es there have been objections that when the frequency of the ?-type Es or fbEs is less than foE that the median count will be adversely affected. Again, however, isn't the scaling rule to follow influenced by whether the purpose of the scaling is to benefit communications or to provide data for the research scientist?
Return to the CONTENTS
It has always been felt that a conference attended by the operators of all the stations in the Australian Vertical Incidence Ionospheric Sounding Network would be of great benefit. Until recently it was considered that it would not be possible to gather all the operators together at one time for various reasons including the difficulty in providing relief staff to operate stations during the regular absence, particularly as the men normally used for station relief should also be present at a station operators conference. A few months ago it was realized that it would be practi-cal to gather all station operators and the relief staff in Sydney for a short time so a conference was arranged. Although the stations in the Australian network are visited at intervals by various members of the Sydney office and there is regular radio communication between the stations and Sydney, it is considered that in some ways the conference achieved things which could not have been accom-plished by any other means. It is suggested that groups of stations in other areas of the world might find it worthwhile to arrange short regional conferences of station operators. A brief account of some of the more important aspects of the Australian conference is given in the hope that this may help others to organize similar conferences.
There was one very fortunate circumstance which helped to make a conference possible. The operators of the four most remote stations in the Australian network (Casey, Cocos Island, Mawson and Vanimo) were due to be replaced and all the new operators were being trained in Sydney. An examination of the airline timetables showed that the operators of the other stations in the network could travel to Sydney fairly quickly and easily. All the station operators have local emergency arrangements for carrying out the minimum tasks required to keep the station in operation if the regular operator is unexpectedly absent. It was considered that, provided the period of absence of the operators was not too long, these emergency arrangements could be used to keep stations operating during a conference. This avoided the need to send relief staff from Sydney and allowed them to attend the conference.
The arrangement was that operators travelled to Sydney during the afternoon of Wednesday the 30th of September, the conference started at 9:00 A.M. on Thursday 1st October and ended at 1:00 P.M. on Friday the 2nd of October. The operators returned to their stations during the afternoon of Friday 2nd of October. This allowed about twelve hours for lectures, demonstrations and discussions and about another five to six hours for informal discussions. The time available for the conference was short and the programme had to be quite intensive. It was considered that a little more time would have been useful but that shortage of time did not seriously reduce the effectiveness of the conference,
One very important aspect of the conference was that it was a gathering of people concerned specifically with the operation of the regular ionospheric sounding programme, station operators not research scientists. The material presented and the discussions centered around station operation, not forgetting, of course, that the stations exist to produce data to be used for research. This was the first conference of station operators for a very long time and it was necessary to consider many other matters in addition to ionogram interpretation and reduction. Only about one third of the time could be devoted to the latter. It was decided that the main objective of the conference in regard to scaling would be to try to achieve more uniformity in interpretation and reduction.
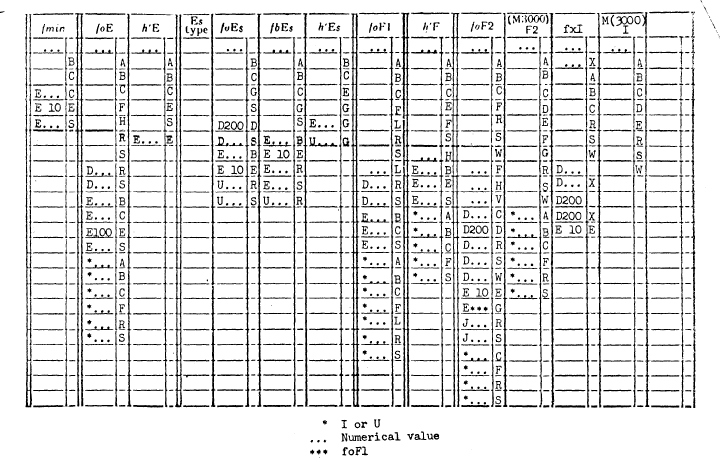
When the programme was being prepared it was realized that some organized approach would be needed to scaling otherwise discussion could become chaotic and unfruitful. Most difficulties ex-perienced in interpretation appear to be associated in some way with the use of the qualifying, des-criptive and replacement letters and so this was chosen as a starting point for the discussions on scaling. Experience gained during the training of station operators had shown that it was necessary to stress that it is not correct to use all letters or combinations of qualifying and descriptive letters for every characteristic. Lists were prepared giving the letters and combinations of let-ters and numerical values which could be used for each characteristic and these lists together with sketches of examples of their use were presented to the conference and discussion centered around these,
The original lists were amended as a result of the discussions and a copy is given below. These lists are not necessarily complete but it was considered by the conference they were correct as far as they went. They may be useful to other station operators. It should be noted that the Australian stations write their results in a form which has the qualifying letter before the numerical value and the descriptive letter after the numerical value. This is an accepted alternative to the arrangement given in the URSI Handbook.
Return to the CONTENTS
by J. Warnock, Aeronomy Laboratory, NOAA, Boulder, Colorado
The primary objective of topside sounding is to obtain the electron-density profile above the height of maximum electron density in the terrestrial ionosphere (Figure 1). This "topside" profile is obtained in a similar manner as the profile below the maximum.
There is, however, one essential difference between topside and ground-based sounding; the spacecraft is immersed in the ionosphere. This has two important consequences: each electromagnetic-wave trace begins at zero virtual range at its minimum frequency (called the cutoff frequency), and a wide variety of plasma waves are stimulated and detected by topside sounders that are not observed by ionosondes. Some of the more common and useful of these additional features on topside ionograms are given in the table below and labeled on Figure 2.
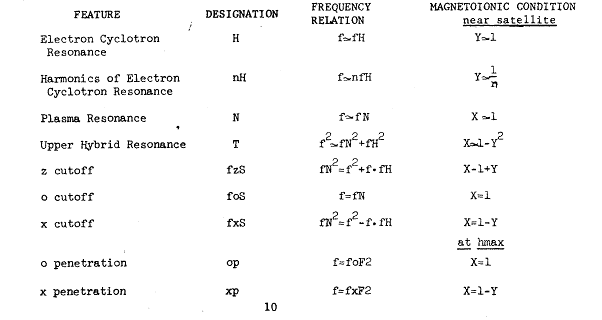
One of these additional waves is also an electromagnetic wave -- the internal extraordinary wave which produces a "z" trace on a topside ionogram (Figure 2).. Thus there are three electromagnetic traces on a topside ionogram instead of two. Both the ordinary, o, and extraordinary, x, ionospheric traces terminate with a penetration cusp at foF2 and fxF2, respectively, just as their ionosonde counterparts. The difference, however, between the ionosonde and topside o and x traces is that the topside o trace is usually incomplete and its beginning is obscured. Thus, the x trace is scaled for true height analysis of topside ionograms instead of the 0 trace.
Since the topside sounder is immersed in the ionosphere plasma it is an accurate diagnostic of the local plasma as well as a remote sensor. That is, the cutoff frequencies (fzS, foS, fxS) and the frequencies and structure of the plasma-wave features yield information on the ambient ionosphere. For example, both the electron density and the magnetic field strength of the local ionosphere are ob-tained from fzS and fxS together. On rare occasions the local gradient of electron density and elec-tron temperatures are also accurate determined.
Date Coverage: All the topside sounding satellites launched to date are in nearly polar orbits. Thus, in middle and low latitudes one orbit yields profiles covering a wide range of latitudes, but at essentially a constant longitude. Consecutive satellite orbits give profiles from the same wide range of latitudes at different longitudes. Furthermore, the local (solar) time at the satellite varies by only several minutes per day except at high latitudes. Therefore, the topside and iono-sonde data compliment each other beautifully, the topside data yielding spatial structure at nearly constant local time and the ionosonde data yielding temporal variations at fixedlocation. Orbital data and sounding parameters of the topside sounders are given in the table below.
The Satellite Controller (located in Ottawa since all three sounders in current operation are Canadian-built) determines the operating schedule to best use the available satellite power (and hence, sounding time) to meet the requirements of the ISIS (International Satellites for Ionospheric Studies) program. A general operating schedule is established for each sounder prior to launch; how-ever, this schedule is modified as the scientific program evolves. For each satellite, the sounding time available per day slowly decreases due to gradual degradation of solar cells and batteries. For example, Alouette I, now over eight years old, operates only 3/4 hour per day. In contrast, ISIS-I, the youngest satellite in the program operates up to about nine hours per day, and can oper-ate continuously for a full orbit, about two hours.
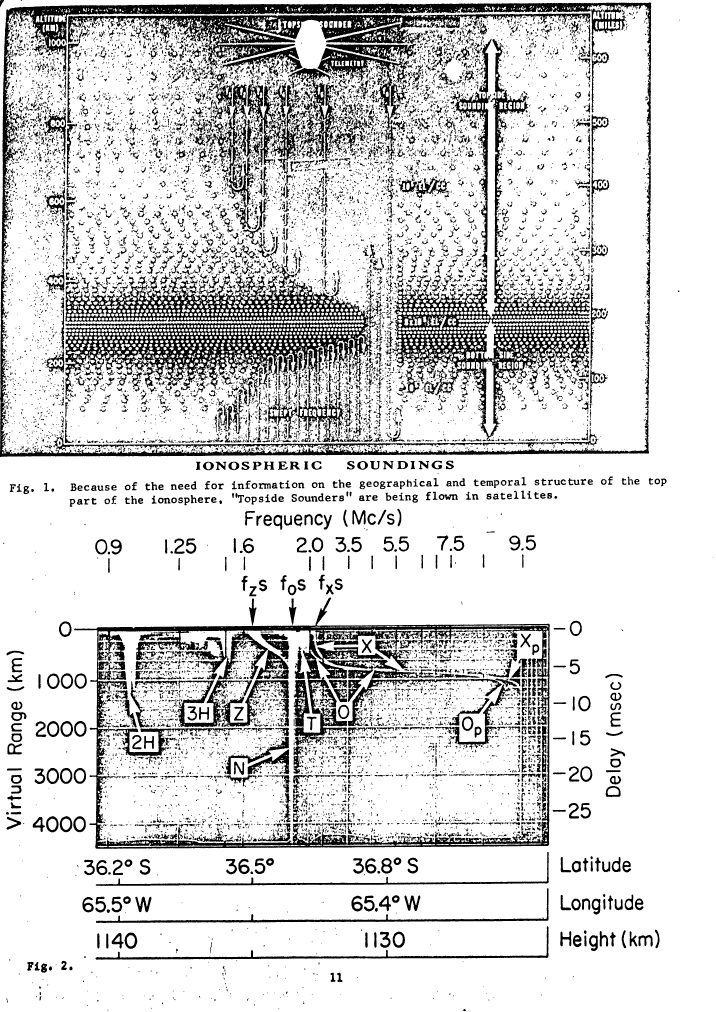
In addition to the location of a satellite and its available power, the operating schedule de-pends on the location of telemetry stations (and on tape recorder capabilities during the early life of ISIS-I). A map showing the location of telemetry stations capable of operating the sounders is shown in Figure 3, Note that the "chain" of telemetry stations in the vicinity of the 75� west longi-tude makes possible continuous coverage from the north pole' to the south pole. These "pole-to-pole" passes are scheduled regularly.
Data Processing: Topside ionograms are not produced automatically at the telemetry station. In-stead, sounding data are recorded on a magnetic tape along with data from other experiments on the spacecraft. These tapes are then shipped to one of three tape-to-film processing centers (located at Ottawa, Ontario, Canada; Slough, England; and Boulder, Colorado, U.S.A.). At these centers ionograms are produced under rigid quality control standards and distributed to workers in the ISIS program. One year after processing the ionograms are deposited in the World Data Center A, Upper Atmosphere Geophysics, NOAA, Boulder, Colorado 80302, U.S.A., where they are available upon request. Further in-formation on topside sounding is contained in the "Special Issue on Topside Sounding and the Ionosphere Proceedings of the IEEE, June 1969.
Return to the CONTENTS
by S. S. Degaonkar, Ahmedabad, India
I came across some of the INAG reports and bulletins which were prepared by an expert committee with you as Chairman. I think the reports represent correctly the feelings and frustrations of the VI operators who run the stations in isolation and submit their data to WDCs and other organizations without knowing the usefulness and applications of collecting such data. I also feel that internation-al exchange of experts in the VI operation and research capabilities should be encouraged and I wel-come any such expert from developed countries to visit Ahmedabad or vice versa. As I am in charge of VI ionospheric station here, I would very much appreciate if you could put me on the mailing list of INAG bulletins and other relevant information and activities. I am trying to see whether fxI para-meter for spread-F can be tabulated regularly at Ahmedabad and made available to WDC along with our monthly ionospheric data.
Return to the CONTENTS
submitted by W. J. Wilson, Director, Telecommunication Regulation Branch, Ottawa, Canada
Five ionospheric stations are operating in Canada for the purpose of making six measure-ments of the ionosphere each hour. There are, of course, a number of other stations that operate for support of special projects.
The Ottawa station has operated continuously since 1942, Churchill, Winnipeg and St. John's since 1944 and Resolute continuously since 1948. Ottawa and Churchill use an LG17 ionosonde, St. John's and Winnipeg an LG17 ionosonde and Resolute uses a 1005W (also known as J5).
Unprocessed film is mailed to Ottawa where the film' is processed and then reduced at the Ottawa Scaling center. While this system presents many problems it does assure a high quality film process and more important, also assures high quality and uniformity of iono-gram interpretation and data process. The various values of ionospheric parameters are in-serted on punched cards and the synoptic values determined by a computer process.
We recently completed a semi-automatic scaling system which uses a "graphic Digitizer" under operator control to record the position of the various points of the ionogram in bi-nary form on a magnetic tape. Once each week the magnetic tape is fed into a computer, where the binary units are converted into values of penetration frequencies, layer heights or 14 factors. Each value is given an address and stored in a specific place on a magnetic disk. At the end of the month, the values are read out to generate the monthly data presen-tation, to produce punched cards and also a magnetic tape from which the "f plots" are pro-duced by a mechanical plotter.
Data are stored for 1 year on punched cards, and then transferred to magnetic tape for permanent storage.
The ionospheric program as of February 1970 is operated by the Research Director-General, Applied Scientific Research Corporation of Thailand, Bangkok 9, Thailand. The modified C-2/4 vertical incidence sounder continues to be used. The data are reduced in Bangkok and sent to the World Data Center A, Upper Atmosphere Geophysics, NOAA, Boulder, Colorado, U.S.A. The following parameters are reduced: foF2, foFl, foE, foES, fbEs, fmin, M(3000)F2, h'F2 and h'F. The sounder was closed down 0700 on 16 January 1970 until 1100 on 2 February 1970 during which time it was relocated from geographic location N13.730 E100.570 to N13.830 ElOO.580. The C-2 has been modified with a C-4 transmitter section, C-4 receiver and C-4 variable frequency oscillator. It sweeps 1-25 MHz in 30 sec with pulse duration 50ms and peak power of about 10kW. The modified Delta antenna now has a 289-ft transmitter section and 235-ft receiver section instead of 500-ft and 200-ft, respectively, previously, with 200 ohm termination in each case. The mission is jointly sponsored by the Military Research and Development Center and the U.S. Office of the Secretary of Defense, Advanced Research Projects Agency, Research and Development Center, Thailand.
Return to the CONTENTS
Please note that through a government reorganization the Environmental Science Services Ad-ministration (ESSA) has been absorbed into a new agency of the U.S. Department of Commerce and ESSA no longer exists. The new organization is the National Oceanic and Atmospheric Administration, NOAA.
In INAG-4 we promised to present a more comp1ete statistical breakdown on the operations of our data center.
During July 1969 through June 1970 we received:
| 1420 |
station |
months |
daily/hourly value tabulations |
| 38 |
station |
months |
on density from vertical soundings |
| 220 |
station |
months |
ms from ground-based stations |
| 290 |
station |
months |
ionograms |
We had 370 different requests for ionospheric data during that time and supplied 16,435 station months of data. This clearly indicates that the ionospheric data are heavily used.
There were 215 requests for vertical soundings data distributed as follows by type of organi-zation placing the request:
28 Private Research Organizations
21 U.S. Government
44 NOAA
49 Universities
32 Foreign (14 different countries)
| 28 |
Private Research Organizations |
| 21 |
U.S. Government |
| 44 |
NOAA |
| 49 |
Universities |
| 32 |
Foreign (14 different countries) |
| 41 |
Data center exchange |
| 215 |
|
Data were requested for all years - not just the most recent ones. The number of times the year was involved in the request is as follows:
| 9 |
1957 |
51 |
1964 |
| 18 |
1958 |
66 |
1965 |
| 16 |
1959 |
62 |
1966 |
| 16 |
1960 |
61 |
1967 |
| 18 |
1961 |
88 |
1968 |
| 26 |
1962 |
102 |
1969 |
| 28 |
1963 |
33 |
1970 |
Data from all ionosphere stations were used by the Predictions Group of the Institute for Telecommunications Science in Boulder. Checking the stations requested for the many other indivi-dual data orders, there is hardly one of the stations in the World Data Center A Catalogue that was not called for (only 24 stations out of 197 were not, and these only operated for short periods of time). Requests varied asking for data from one station for a specific month, to asking for all stations between N55 to S55 for several months, or for all stations between specific longitudes, or for stations in a specified geographic area.
Mine. V. Troitskaya of the U.S.S.R. visited WDC-A in October. It was agreed to exchange de-tails between WDC-B2 and WDC-A at the working level to assist each other. WDC-A will send samples of their work forms, record keeping techniques, etc., to WDC-B2, and looks forward to receiving similar reports from them.
WDC-B2 is to be congratulated in having sent ionogram copies for Moscow and Alma-Ata for as late as March and April 1970, respectively.
Miss J. Virginia Lincoln, Director of WDC-A, was able to spend a day at Slough in September. Fruitful discussions were held on data interchange, cataloguing and use of the computer for data re-quest control. WDC-CL should be commended for sending ionogram copies for Slough for as late as March 1970 and Singapore for May 1970.
Return to the CONTENTS
by W. R. Piggott and K. Rawer, Editors
The editors would like to thank all those who have made comments on the proposed new Chapter 5, "Top-Side Ionograms . This chapter has given us much trouble as there is no agreed international model for such a chapter. Relatively few groups, most of which are highly specialized, have had ex-perience in analysis of top-side soundings. Fortunately a special issue of the Proceedings of the I.E.E.E. was published in June 1969 (Vol. 57, No. 6, p. 859-1171) under the title "Topside sounding and the Ionosphere". This gives authoritative detailed accounts of top-side sounding and the pheno-mena observed with its aid with numerous ionograms and examples. We have, therefore, restricted the chapter to an outline of the main points and a description of the conventions in use by the main groups. The chapter should be read in conjunction with the Special Issue, just as the first edition of the Handbook should be read in conjunction with the Annals of ICY Vol. III part I. Our policy has been to draft the chapter using our own experience and then send it to those known to be interes-ted for comment and correction. This has been quite effective in producing critical comments and proposals for alterations. There is still time if you also wish to contribute.
We are aware that a number of stations have no Handbook and that it is urgently necessary to pro-duce a second edition. However, this work is additional to our normal responsibilities and consumes much time. We have also had to help with the Leningrad Seminar and South American trip this year, both of which have also involved time. The result is that progress has been slower than we had hoped.
Most of the comments made to us on the Second Edition amount to requests for much more detailed instructions on ionogram interpretation preferably illustrated by ionograms. We are attempting to meet these requests, at least partially, though we must point out that it is not possible to des-cribe every possible case without causing much difficulty for the reader, particularly for the reader whose English is limited. We have, therefore, added some descriptive paragraphs to meet the de-mand, stressing that these are examples and not international definitions.
It is not possible, without delaying the Handbook by a year or more, to illustrate it fully with ionograms -- we do not have the resources or effort to look through large numbers of ionograms and choose and reproduce typical examples. If any of you have selected ionograms, e.g. used in train-ing, which you could let us have, we would consider putting them in the Handbook as examples. The reproduction would be similar to that obtained in the Atlas. Such examples should be sent to:
W. R. Piggott
Radio and Space Research Station
Ditton Park
Slough 5L3 9JX
Bucks, England.
We would like to invite volunteers to read and comment on other chapters of the Handbook. These follow the chapters in the first edition except that section S2, Electron Density Analysis is transferred to the main text and greatly shortened. The volume of the manuscript prevents us from circulating it as a whole.
The editors are now gathering material for the High Latitude supplement which we would like to illustrate with ionograms. If you have suitable material, in particular material used for training operators at high latitude stations we would be pleased to receive copies. The original Handbook was largely based on texts in use in different organizations. We would also stress the need for more discussion, either in local groups or through the INAG Bulletin, so that we can see the advantages or disadvantages of the differing proposals put up to us. Do not forget that we cannot take note of discussions unless we hear about theme
At the time of the Leningrad Symposium last May it was learned that Mine. Mednikova had translated into Russian selected portions of the first three INAG Bulletins. It is to be hoped that she and her colleagues will continue to translate these bulletins at least in part for the sake of their sta-tion personnel not familiar with the English language.
The first ISP Alert was issued October 28, 1970: "ISP Alert Magnetic Storm expected on 30 close 12 UT. Please start immediately the ISP program. MIEUDON 28/1515 UT". The expected storm did not materialize so that the following message was sent November 2, 1970: "ISP message. Not any event reported at this date. Please stop ISP program and cancel the alert. MEUDON 02/08 UT".
A second alert was issued November 5, 1970: "ISP Alert. Magnetic storm expected on 06 close 08 UT. Please start immediately the ISP program. MEUDON 05/0930 UT". This storm materialized; therefore, a second message stated: "ISP Message. SSC has been reported 07/0046 UT. ISP program will be completed on 12/0000 UT. MEUDON 07/1200 UT".
In addition to the stations for the American sector listed in INAG-4, p. 11, Arecibo, Boulder, Canadian network, College, Godhavn, Narssarssuaq, Point Arguello and Thule are also participating.
It is to be hoped that fruitful research will result from the wide coverage of the phenomena before and during this storm which reached a moderately severe level of disturbance.
World Data Center A - Upper Atmosphere Geophysics UAG Report on the March 6-10, 1970 event is scheduled for publication by the end of December 1970. It should be of special interest to ionosonde stations since it will contain several contributions dealing with the ionosphere. About one-third of the 100 contributions to be submitted deal with the ionosphere. The papers will deal with iono-spheric absorption, VLF anomalies, scintillations, total electron content, drifts and incoherent scatter in addition to ionospheric vertical soundings, during the great magnetic storm of that period. Some of the studies will also include the effects of the total solar eclipse of March 7, 1970. The ionospheric reports are being submitted from research scientists in Brazil, Denmark, GDR, India; Peru, Philippines, Sweden, U.K., U.S.A. and U.S.S.R., so that worldwide effects will be covered by the many reports.
Return to the CONTENTS
HOME - INAG
Back to Bulletins index
Site maintained by Phil Wilkinson
IPS Radio and Space Services
P O Box 1386
Haymarket NSW 1240
AUSTRALIA
This page was last updated 3 November 1999.
Comments or suggestions can be directed to
phil@ips.gov.au