


A GEOSAT Discharge Model
A satellite may become charged due to different physical phenomenon. The photoelectric effect (sunlight) may cause charging. If the satellite is orbiting in a high electron flux, it may acquire charge from the space environment. Satellites in geosynchronous orbits are particularly susceptible to this phenomenon due to their location in the outer regions of the outer radiation belt.This belt is predominantly populated by electrons.
If the charge on a satellite reaches a critical value, then a discharge can occur which may cause damage to one or more of the satellite systems. Of particular concern is the phenomenon termed Deep Dielectric Discharge (DDD). In a flux of high energy electrons, the electrons penetrate the spacecraft outer surface and bury themselves in dielectric materials such as circuit boards and the insulation in coaxial cables. The buildup of charge will continue until the dielectric strength of the material is exceeded, when a sudden electrical discharge will occur. This miniature lightning stroke can cause permanent damage in the associated or nearby circuitry.
Exact data on the DDD phenomenon is hard to come by. USAF satellite operators are issued warnings when the daily electron fluence >2 MeV (electrons/sq cm/steradian/day) at geosynchronous orbit meets either of the following conditions:
- greater than 3 x 10⁸ per day for 3 consecutive days
- greater than 109 for a single day
A paper in the Space Weather Journal(1) provides a little more qualitative information. They provide the experimental results for a DDD event as a function of electron fluence >300 keV from the SCATHA satellite, near geosynchronous orbit. The graph, which is drawn from the results of Vampola (stated as a private communication), as shown below:
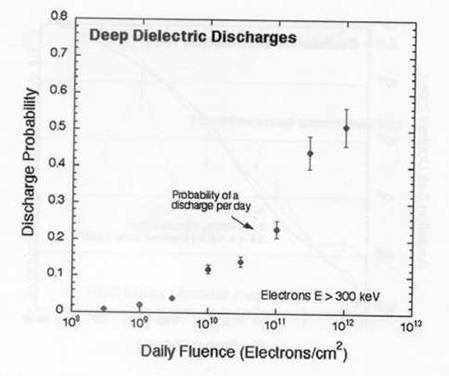
Now, the GOES electron fluence, which SWO reports on the SEC web site daily is for the electron fluence >2 MeV. For the above graph to be useful, we must find a relation between the >300 keV and the 2 MeV electron populations. The AE-8 electron radiation belt model is the one most commonly used for examining radiation belt electron fluxes at this time. An examination of this model show that the relation between the two fluxes is not a simple one, and varies with position in the radiation belt. However, at an L value of 6.6, which is where the geosynchronous orbit lies, the flux of >2 MeV electrons is typically two orders of magnitude below the >300 kev flux.
Thus for this model the fluence axis is shifted by two orders of magnitude and then a Lorentzian growth curve is fitted to the points to produce the model algorithm. The graphical model is shown below:
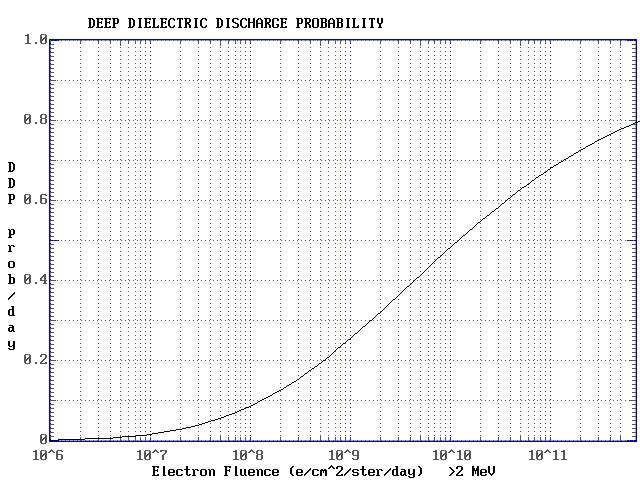
This curve has the form:
prob {DDD} = z4.5 / (1200 + z4.5)
where
z = log10( Fluence ) - 5
This is the probability of a DDD during the day in which the electron fluence (>2 MeV ) is specified.
The occurrence of a DDD on a particular satellite will depend on the actual configuration of and the electronics in the satellite. Engineering techniques employed in the construction of a satellite can make it more or less susceptible to DDD. For this reason, it is probably best to term the probability computed in this model the normalised (or standardised) daily probability of a DDD occurring given a specified electron fluence.
Implementation of the model requires the fluence to be input from the GOES value (available from the SEC web site). The formula above is then employed to calculate a single daily normalised probability of DDD for a satellite in geosynchronous orbit (where the fluence was measured).
Reference
D N Baker, S G Kanekal and J B Blake, Characterizing the Earth's outer Van Allen zone using a radiation belt content, Space Weather, v2, S02003, doi:10.1029/2003SW000026, 2004.